Archive for the ‘Valuation’ Category
Top of the residential market?
Ever wonder where the top of the residential market is? A small part of our practice at Greenfield over the years has been consulting on really top-tier, “trophy” real estate. Valuing these properties is part art, part science, and everyone in that rarified realm is always trying to figure out where the top might be.
It appears that some of the very top of this market is softening, according to an article yesterday on CNBC.com by Robert Frank, their wealth editor. As it happens, tax law changes and a pull-back by foreign investors (particularly from China) means that the very top tier of properties have seen pricing reductions this summer. Indeed, the top 500 homes on the market saw total price reductions of $1 Billion of late.
For example, the Ziff family estate in Florida was previously on the market for $195 million. After two price reductions in a year, it is now down to $138 million, a reduction of over a quarter in its offer price, and still with no takers. Sean Elliott, one of the leading brokers for mansions such as this, notes that there are no comparable transactions to go on. Indeed, often such properties have to test the market first, and then adjust prices accordingly.
The article makes good reading, even if you’re not presently in the market for a $100 million beach house: The $1 billion price cut: Luxury real estate gets slashed.
Share this:

Home prices up, sales down
Reuter’s reported this morning that sales of existing homes are down and prices are up. Economists had forecasted an increase year-over-year of 0.6%, according to National Association of Realtors statistics, which would have been a pretty good jump. In fact, sales actually fell by 2.2% from June, 2017 to June, 2018.
Sales rose in the northeast and Midwest, but fell in the west and south. Existing home sales make up about 90% of the market (the other 10% from new homes). As we’ve reported before, rising costs and lack of infrastructure are driving up new home prices and driving down new home availability. This means that demand drives up prices, and ultimately drives down volume. (This was the part of the supply/demand equilibrium lecture that drove so very many college freshmen to major in something other than economics.) Annual wage growth has been stuck below 3% for some time now, and median house prices are now up 5.2% from last year, to a record high of $276,900. According to NAR, this is the 76th consecutive month with year-to-year price gains.
Supply at the lower end of the market — starter homes and rental homes — dropped by 18% from last year. This is problematic since first-time buyers accounted for 31% of all transactions in June. However, economists estimate that in a healthy market, first-time buyers would account for a 40% market share. All in all, these are not the signs of a healthy housing market.
Share this:
Commercial property prices
First, a happy 4th of July to all of our U.S. readers! I’ve spent the day catching up on reading, writing, and napping. I hope you’ve all done the same.
Part of my reading was a recent piece by Calvin Schnure for the members at NAREIT titled Commercial Property Prices Continue Steady Gains. It’s an interesting read, and factually correct. However, Mr. Schnure and I might arrive at somewhat different conclusions. Case in point is illustrated by the graphic below, taken from his article:

Now, if you are running a REIT and want to convince potential investors that the world is rosy, then this is a very pretty graphic. On the other hand, if you are a real estate analyst (ahem…. please hold your applause) you have to wonder what the heck is going on here. I’m particularly concerned with multi-family, which has increased in value on the order of about 60% since the previous peak (December, 2007) but is up by something close to 160% since the trough of 8 years ago. Yeah. That’s a huge run-up. Couple that with the observations (anecdotal, at present) that multi-family vacancies are on the rise nationwide, and particularly, surprisingly, in formerly hot markets like Seattle (just to name names).
I’m not preaching a long-term or even intermediate term demise for multi-family. Far from it, in the long term, these are still worth considering. However, in the short-term, these annualized gains may not be sustainable.
By the way, there’s a lot more in the NAREIT article, and it’s worth reading in its entirety.
Watch this space. We’ll keep you posted.
Share this:

And yet more on housing
Twice burned, you know? I think we should all be a bit gun-shy about rapidly increasing house prices. Are we looking for a bubble or a peak?
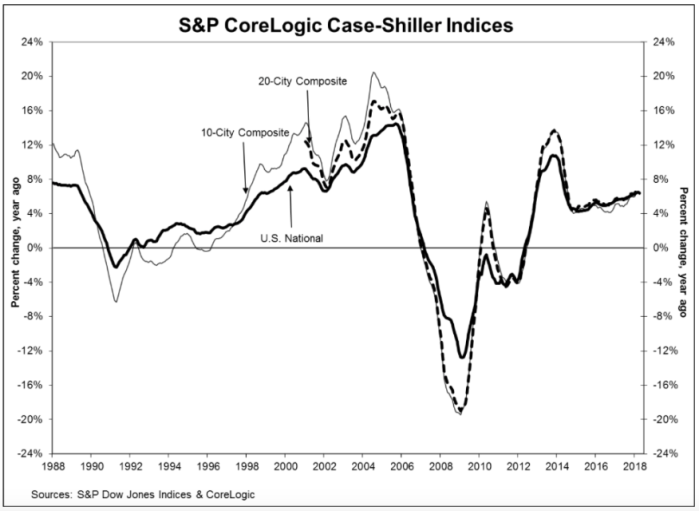
The S&P CoreLogic Case-Shiller U.S. National Home Price NSA Index, reported a 6.4% annual gain in April, slightly down from an annualized rate of 6.5% in March. While they produce a few other indices, all of them basically report the same thing. Oh, by the way, my home city of Seattle leads the pack with an annualized rate north of 13%.
Glancing at the graphic, below, the slope of the current pricing graph looks suspiciously like what we saw during the bubble run-up. As I’ve noted here previously, house prices increasing at a rate higher than 2 points over inflation is emblematic of a bubble. That would suggest a nationwide rate somewhere around 4% – 5% right now. You do the math.
Share this:

Deconstructing house prices
I stumbled on a very interesting graphic on the inter-web the other day. I can’t provide the citation just yet — it was posted anonymously on a data visualization web site. Nonetheless, I’ve done a bit of research to semi-validate these numbers, and even if they’re off a bit, it’s a very useful graphic.
First, it tells us that since 2002, the median price of a new home in America has approximately doubled, from $175,000 to about $350,000 (depending on exactly which metrics you use, this is about right). That’s an inflation rate of about 100%, more or less, in 15 years (end of 2002 to end of 2017). In a paper I presented at the American Real Estate Society annual meetings about 10 years ago, I noted that post-WW2 data indicated that house prices/values should be expected to grow annually at a rate of about 2 percent points above the inflation rate. I checked, and the actual inflation rate over that period measured by the CPI totaled 36%, more or less. That averages about 2.1% per year, compounded. The doubling of house prices in 15 years equates to an inflation rate of about 4.7%. So…. 4.7 minus 2.1 = 2.6. Thus, by my estimation based on historical averages, house prices have been growing about 0.6% per year faster than they should have since 2002.
You might argue that some of that was the last few years of the housing bubble, but that sponge got squeezed out in the post-bubble collapse. Nope, folks, what we’re seeing is the echo bubble. You might also argue that 0.6% doesn’t sound like much, but here’s what it amounts to over time. If house prices had actually grown at the rate suggested by previous post-WW2 data, then prices would only have gone up by about 170% over that time period. That means that a $175,000 house from 2002 should today be selling for about $295,000. The difference (350,000 minus 295,000) of about 17% is the measure of the echo bubble — it’s the degree to which houses are currently overpriced.
Ahem…. that’s NOT the point of this story. That’s just the introduction. The more important story comes from deconstructing house prices into various tranches. This graphic I found does a wonderful job of that:
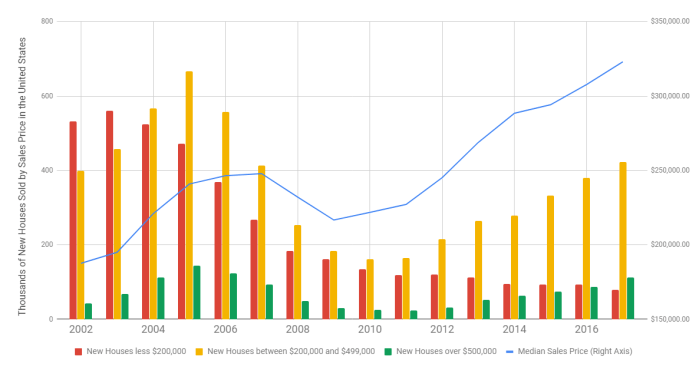
Here’s my point in a nutshell. Note that in 2002, the plurality of homes built were in the “less than $200,000” category. Today, that’s the smallest category (the one in red). Conversely, we’re building about twice as many homes in the expensive category (the green bar) as we were in 2002. While all housing starts are down from the peak, compared to the earlier years, we’re now building the bulk of the housing in the two most expensive categories, which is a real shift from 2002.
Why? The market is constantly screaming about the lack of supply for “affordable housing”. Why aren’t builders building to that tranche of the market? The answer is cost. Two very disruptive forces are plaguing the homebuilding industry today. First, the labor and infrastructure for building died off during the recession. We have relatively fewer trained and skilled tradespeople, fewer developed lots (and a shrunken pipeline for development) and more expensive construction lending. Second, the building materials themselves — lumber and steel — are in short supply, have been affected by price increases, and are now faced with tariffs. Builders have no choice but to build more expensive homes to be able to cover the cost of construction.
Are we headed for a new bubble? Back in the dark ages, when I was in graduate school, we were taught that inflation could be caused by either demand-pull (too much money chasing too few goods) or cost-push (increases in commodity costs). Either way you look at it, the cost of owner-occupied housing is going thru the roof (pun intended).
Share this:

Collapsing Price of Alternative Energy
Most — nearly all — of our work is in real estate, but energy has a huge real estate component, so major shifts in the energy market have significant implications for real estate investment.
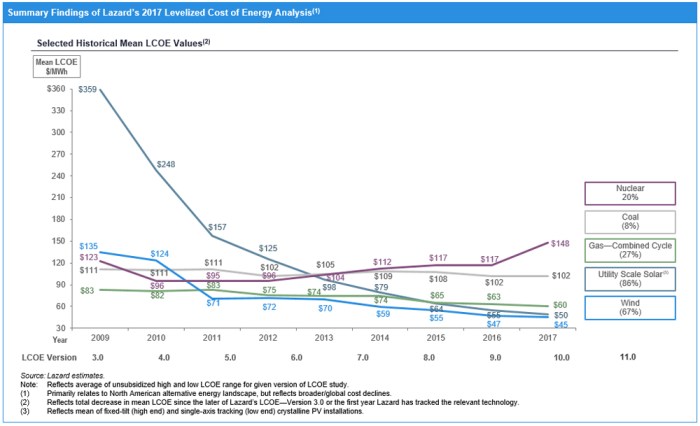
A recent report out of Lazard reflects just such a major shift. Specifically, among five major sources of energy, wind and solar are now the low-cost alternatives. Indeed, since 2009. the cost of solar energy (at a utility scale — not just what’s on the roof of your house) has declined by 86% to about $50 per megawatt hour. Coal, for example, has declined in price only 8% during that period, and is now $102/MWh, or double the cost of solar. Wind is even cheaper, at $45/MWh.
Thanks to Lazard for the accompanying graphic.
The implications for real estate are obvious. If and as utilities shift supply sources, and focus on alternative energy to meet increasing demands, there will be an accompanying demand for solar farms, wind farms, and new transmission lines. Accompanying this, we’ll probably see a decreased utilization of coal mines, and certainly a reduced demand for new coal mines.
Share this:

Commercial Real Estate — Prices vs Values
Anyone involved in real estate knows that commercial prices and values have been on a constant uptick since the trough following the recession. The very length and breadth of the recovery has caused nervousness among investors, appraisers, and lenders. Today, I’m looking at two somewhat disparate views on the subject.
First, Calvin Schnure, writing for NAREIT, looks at four measures of valuation:
- Cap rates and cap rate spreads to Treasury yields
- Price gains, either from increasing NOI or decreasing cap rates
- Economic fundamentals, such as occupancy and demand growth
- Leverage and debt growth
At present, none of these is giving off warning signals, according to Schnure. Cap rates continue to be low compared to other cycles, but so are yields across the board. There continues to be room for cap rate compression, in Schnure’s assessment. As for price changes, every sector is showing growing or at least stable NOI, with the proportion of price changes coming from NOI now equal or exceeding price increases coming from cap rate declines. Across the board, REIT occupancy rates are high and on the rise, with industrial and (surprisingly) retail at or near 95%. All equity REITs are in the low 90% range, compared to the high 80’s at the trough of the recession. Finally, debt levels are rising, but at a lower rate than valuations. Ergo, this is not, in his opinion, a debt-fueled cycle. Right now, debt/book ratios are significantly lower than in the previous FOMC tightening cycle (2004-2006). For a full copy of Schnure’s article, click here.
Second, I was at the American Real Estate Society’s annual meeting in Ft. Myers, FL, last week, and had the great pleasure to sit in on a presentation by my good friend Dr. Glenn Mueller of Denver University, the author of the widely acclaimed Market Cycle Monitor. He tracks property types and geographic markets by occupancy, absorption, and new supply statistics, and for years has proffered a very accurate measure of commercial real estate, both nationally and locally, across four potential phases:
- Recovery (rising, although unprofitable rents and occupancy)
- Expansion (rising and profitable rents and occupancy, stimulating new construction)
- Hypersupply (oversupply of new construction and declining rents and occupancy)
- Recession (unprofitable and declining rents and occupancy)
Most markets cycle through these phases in a fairly predictable fashion. Right now, most markets (property types and geography markets) appear to be in the expansion mode, with some (notably, apartments) potentially crossing the line into hypersupply.
In short, commercial real estate markets look healthy, absent the sort of exogenous shocks that sent us into the most recent recession. That said, many of those same metrics read positive prior to the mortgage market melt-down. Of course, commercial real estate actually faired pretty well during the recession, compared to many other asset classes, supporting the notion that in times of economic trouble, real estate equities can be great storers of value.
Share this:
AON’s Global Risk Management Survey
The good folks at AON just shared with me their very detailed Global Risk Management survey for year-end 2017. It’s a terrific document, very thoroughly researched, and I commend them for the effort they put into this. (Full disclosure – neither I nor Greenfield, nor any of its affiliates, have any interest in AON.). This is the sort of study that should be on the desk of every CEO who has globally-affected interests, and certainly real estate and private equity fall into that category.
The document is chock-full of good stuff, and I’ll revisit this in future posts. Two interesting comments, however, hit me right up front. First, and I’ll simply quote from the survey, “…developed nations, which were traditionally associated with political stability, are becoming new sources of volatility and uncertainty that worry businesses…”. Of course, they’re taking about the U.S. and its misguided trade war, BREXIT, the elections in Northern Europe, and the impeachment of the South Korean president.
Second, what are the top concerns for global businesses and wealthy families? The list may come as a surprise to those who don’t follow these important sectors, but these certainly make sense in today’s climate:
- Damage to reputation/brand
- Economic slowdown / slow recovery
- Increasing competition
- Regulatory / legislative changes
- Cyber crime / hacking / viruses / malicious codes
- Failure to innovate / meet customer needs
- Failure to attract or retain top talent
- Business interruption
- Political risk / uncertainties
- Third party liability
I can tell you Greenfield is deadly serious about these issues. You should be, too.
Share this:
Quarterly Phily FED survey
Hey, gang! It’s been a while! I’ve been having a darned good winter, how about you? It’s been busy, I’ll say that, hence the gap since my last post.
Anyway, as you may know by now, I’m a regular follower of the Phily Fed’s quarterly survey of economic forecasters. It’s a delightfully simple model — just ask a not-so-random group of economist where they think the economy is headed, then look at both the central tendency (you know, mean, median, mode, that stuff) as well as the dispersion of forecasts (standard deviation, median absolute deviation, stuff like that). The results are not only interesting in and of themselves, but also it’s fascinating to track what the forecasters were saying a quarter ago compared to what they’re saying now (which the FED does).
For example, the forecasters, PREVIOUSLY (end of the year last year) projected that GDP growth for 2018 would be 2.5% (real, annualized), the unemployment rate would be 4.1% on average (and 4.0% at year-end) and that we would add 163,400 folks to the nation’s payrolls on average each month during the year. Today, however, these same forecasters have up’d the ante a bit, forecasting real GDP growth at 2.8% for the year, average unemployment at 4.0% (and ending the year at 3.8%) and adding 175,100 workers to payrolls per month.
Now, don’t get too excited, folks, because as with everything the “devil’s in the details.” A big chunk of the change comes from shifting the shape of the new employment curve. Previously, the forecasters projected a fairly flat payrolls change over the year — not bad, just flat. However, new forecasts project this to be skewed to the early part of the year, and then declining after the summer. Indeed, 2019 is currently projected to be anemic. Early employment numbers has the effect of driving up GDP (people earn and spend money for more months in the year). Note that when we look at the dispersion of GDP growth, there is some great news (very little sentiment for a recession this year) but also some not-so-great news (very little sentiment for growth above 4%).
The Phily FED also surveys for inflation projections, but that’s been flat-lined for years now. Current CPI projections for the year are 2.1%, which is the same as previous projections. Of more specific interest to us at Greenfield, the Phily FED is now reporting forecasts of house price growth for the coming two years, although rather than use their regular panel they are synopsizing several publicly available indices (Case-Shiller, FHFA, CoreLogic, and NAR). In general these indices point to price growth from 4% to 5.2% this year, and slightly lower growth (3.3% to 5.1%) next year.
There’s a bit more to the survey, and if you’d like you’re own copy, just click here.
Share this:
So, folks, where are we going to live?
Much has been said recently about housing starts being back up to where they were before the recession. If this is the case, then why does Seattle, for example, have a 0.9 month supply of homes for sale? As usual, the details are much more complicated than the headlines.
Prior to the “meltdown” (let’s say, 2004 – 2007), housing starts in the U.S. averaged about 1.865 million units per year. Now, few analysts disagree that this was too many, but figuring out the right number is harder than one might think. In 2008, the number dipped down to about 905,000, and hit a low of 583,000 in 2009. Since then, the annual starts have trended up. However, in 2016, we still were only at 1.207 million. Of that, only 751,000 were single family units, compared to an average of 1.4 million single family homes per year in the 2004-2007 period. Hence, nationally, we’re building about half as many homes as we were 10 years ago.
From 2004-2007, we started 7.462 million dwelling units in America, but in the past four years we’ve only started a total of about 4.432 million (all varieties). That’s a shrinkage of about 3 million new homes, and most of that shrinkage is in the single family category.
One might posit that the decline in home ownership rates should have freed up some demand, and some of that’s true. The home ownership rate in America peaked at 69% during the run-up to the recession, and dropped steadily after the melt-down, to a low of 62.9% in the 2nd quarter 2016. As of the end of the 3rd quarter this year, it sits at 63.9%, or about 5 points below the peak of a decade ago.
There are about 76.146 million owner-occupied housing units in the U.S. today. A five-percent swing in this number is a little over 3.5 million houses. In short, we’ve now “absorbed” the decline in starts, and structurally we’re more-or-less “over” the recession, and we’re simply not building enough new homes to meet the demand.
Several consequences came out of the melt-down. First, developing land takes quite a few years — five or more in the “hot” areas like Seattle, where land has to go thru a permitting and entitlement phase long before a house can be built. All of this requires land planners, both in the private sector and downtown at the county or city hall. Many of these folks lost their jobs during the 2008-09 period, and indeed some county and city planning offices were eviscerated. New home development frequently requires a significant outlay in public infrastructure, including schools, roads, and utilities. Worse than that, many construction trades were gutted, with no replacements available. Financing for acquisition, development, and construction is now problematic (although, arguably, it was too liberal pre-recession).
As such, it’s a sellers market for homes, and in hot markets, buyers compete by bidding up prices beyond reasonable levels. Some pundits are nervous, and with good reason.
(Thanks to the U.S. Census Bureau for the October 31 data.)


