And yet more on housing
Twice burned, you know? I think we should all be a bit gun-shy about rapidly increasing house prices. Are we looking for a bubble or a peak?
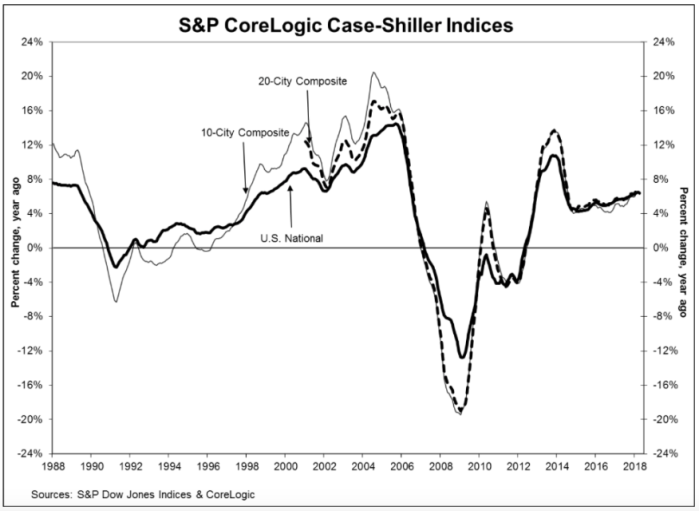
The S&P CoreLogic Case-Shiller U.S. National Home Price NSA Index, reported a 6.4% annual gain in April, slightly down from an annualized rate of 6.5% in March. While they produce a few other indices, all of them basically report the same thing. Oh, by the way, my home city of Seattle leads the pack with an annualized rate north of 13%.
Glancing at the graphic, below, the slope of the current pricing graph looks suspiciously like what we saw during the bubble run-up. As I’ve noted here previously, house prices increasing at a rate higher than 2 points over inflation is emblematic of a bubble. That would suggest a nationwide rate somewhere around 4% – 5% right now. You do the math.


Leave a comment