Archive for the ‘Mortgage Lending’ Category
Inflation outpacing wages. Fed expectations?
Those of us who lived through the 1970’s may think that 3% or 4% inflation is childsplay, but the FED doesn’t necessarily look at it that way. Indeed, they’re an “inflation conservative” bunch, and don’t take too kindly to the CPI heading northward.
An article this morning in CNN Money offers two painful scenarios. First, inflation is nudging up, in no small part from housing costs and health care costs. Add to that the impending impact of the coming Trade War, and the news isn’t very good.
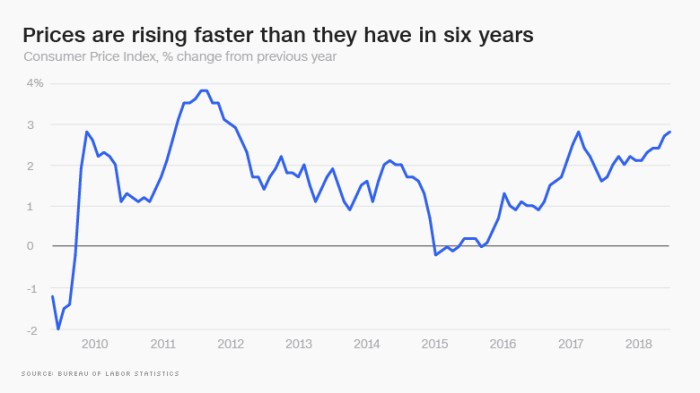
Graphic courtesy money.cnn.com
Second – and we’ve been predicting this – consumer prices are rising higher than wages. The difference isn’t very big at the median, only 0.2 percentage points, but given the disparate increases in incomes in America of late, and the disparate consumptions patterns, this means that the burdens of cost inflation are being disproportionately felt by working families.
More to come….
Share this:

Commercial property prices
First, a happy 4th of July to all of our U.S. readers! I’ve spent the day catching up on reading, writing, and napping. I hope you’ve all done the same.
Part of my reading was a recent piece by Calvin Schnure for the members at NAREIT titled Commercial Property Prices Continue Steady Gains. It’s an interesting read, and factually correct. However, Mr. Schnure and I might arrive at somewhat different conclusions. Case in point is illustrated by the graphic below, taken from his article:

Now, if you are running a REIT and want to convince potential investors that the world is rosy, then this is a very pretty graphic. On the other hand, if you are a real estate analyst (ahem…. please hold your applause) you have to wonder what the heck is going on here. I’m particularly concerned with multi-family, which has increased in value on the order of about 60% since the previous peak (December, 2007) but is up by something close to 160% since the trough of 8 years ago. Yeah. That’s a huge run-up. Couple that with the observations (anecdotal, at present) that multi-family vacancies are on the rise nationwide, and particularly, surprisingly, in formerly hot markets like Seattle (just to name names).
I’m not preaching a long-term or even intermediate term demise for multi-family. Far from it, in the long term, these are still worth considering. However, in the short-term, these annualized gains may not be sustainable.
By the way, there’s a lot more in the NAREIT article, and it’s worth reading in its entirety.
Watch this space. We’ll keep you posted.
Share this:

And yet more on housing
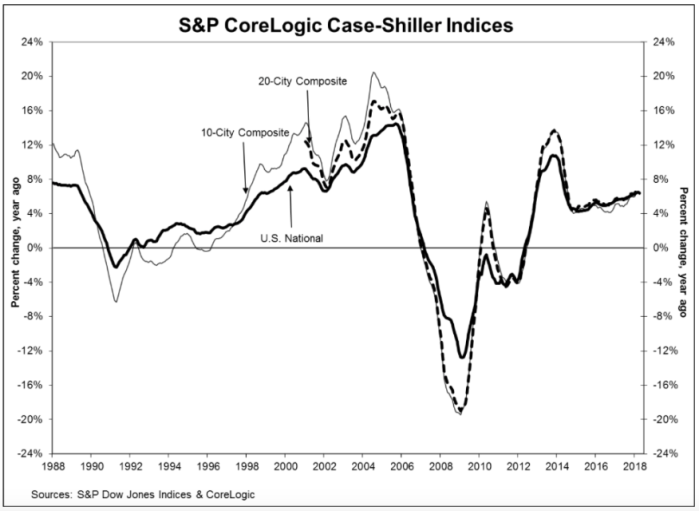
Twice burned, you know? I think we should all be a bit gun-shy about rapidly increasing house prices. Are we looking for a bubble or a peak?
The S&P CoreLogic Case-Shiller U.S. National Home Price NSA Index, reported a 6.4% annual gain in April, slightly down from an annualized rate of 6.5% in March. While they produce a few other indices, all of them basically report the same thing. Oh, by the way, my home city of Seattle leads the pack with an annualized rate north of 13%.
Glancing at the graphic, below, the slope of the current pricing graph looks suspiciously like what we saw during the bubble run-up. As I’ve noted here previously, house prices increasing at a rate higher than 2 points over inflation is emblematic of a bubble. That would suggest a nationwide rate somewhere around 4% – 5% right now. You do the math.
Share this:

Lumber and other simple stuff
Tariffs anyone? Jann Swanson wrote a great piece for Mortgage News Daily last week, titled “NAHB: Lumber Shortages and Prices Hamper Affordability.” In short, the shortages of framing lumber are “now more widespread than any time” since the National Association of Homebuilders began tracking in 1994. About 31% of single-family builders reported shortages of framing lumber in the most recent survey, along with shortages in other building materials. A full 95% of homebuilders reported that prices of these materials were having an adverse impact on housing affordability.
While there are numerous reasons for this, including a shrinkage in the building infrastructure during the several years following the housing melt-down, the NAHB notes that the top five building materials with shortages are on the Trump Administrations list of tariff targets.
Share this:

So, folks, where are we going to live?
Much has been said recently about housing starts being back up to where they were before the recession. If this is the case, then why does Seattle, for example, have a 0.9 month supply of homes for sale? As usual, the details are much more complicated than the headlines.
Prior to the “meltdown” (let’s say, 2004 – 2007), housing starts in the U.S. averaged about 1.865 million units per year. Now, few analysts disagree that this was too many, but figuring out the right number is harder than one might think. In 2008, the number dipped down to about 905,000, and hit a low of 583,000 in 2009. Since then, the annual starts have trended up. However, in 2016, we still were only at 1.207 million. Of that, only 751,000 were single family units, compared to an average of 1.4 million single family homes per year in the 2004-2007 period. Hence, nationally, we’re building about half as many homes as we were 10 years ago.
From 2004-2007, we started 7.462 million dwelling units in America, but in the past four years we’ve only started a total of about 4.432 million (all varieties). That’s a shrinkage of about 3 million new homes, and most of that shrinkage is in the single family category.
One might posit that the decline in home ownership rates should have freed up some demand, and some of that’s true. The home ownership rate in America peaked at 69% during the run-up to the recession, and dropped steadily after the melt-down, to a low of 62.9% in the 2nd quarter 2016. As of the end of the 3rd quarter this year, it sits at 63.9%, or about 5 points below the peak of a decade ago.
There are about 76.146 million owner-occupied housing units in the U.S. today. A five-percent swing in this number is a little over 3.5 million houses. In short, we’ve now “absorbed” the decline in starts, and structurally we’re more-or-less “over” the recession, and we’re simply not building enough new homes to meet the demand.
Several consequences came out of the melt-down. First, developing land takes quite a few years — five or more in the “hot” areas like Seattle, where land has to go thru a permitting and entitlement phase long before a house can be built. All of this requires land planners, both in the private sector and downtown at the county or city hall. Many of these folks lost their jobs during the 2008-09 period, and indeed some county and city planning offices were eviscerated. New home development frequently requires a significant outlay in public infrastructure, including schools, roads, and utilities. Worse than that, many construction trades were gutted, with no replacements available. Financing for acquisition, development, and construction is now problematic (although, arguably, it was too liberal pre-recession).
As such, it’s a sellers market for homes, and in hot markets, buyers compete by bidding up prices beyond reasonable levels. Some pundits are nervous, and with good reason.
(Thanks to the U.S. Census Bureau for the October 31 data.)
Share this:
Housing…. overheated again?
“Home price increases appear to be unstoppable,” — a quote from David M. Blitzer, Chairman of the Index Committee at S&P Down Jones Indices, as quoted in a Tuesday article by Christopher Rugaber of the Associated Press, and featured on usatoday.com. Am I the only one who felt cold chills reading that?
C’mon, David, exactly how did that turn out last time? Prices, by the way, are headed up because money is still relatively cheap, demand is incessant, and supply is constrained. S&P, which is in business, among other things, of promoting their Case Shiller index, notes that buyers are in bidding wars. That index, released Tuesday, showed that house prices are up 6.1% from a year ago — well above inflation — and in 45% of the cities tracked, the house price increase has surged from a month earlier. In short, not only is the car speeding, it’s accelerating.
However, sales volume has fallen 1.5% from a year ago. That may not sound like much, but in a market that was already not at equilibrium, that’s economically significant. Plus, the number of homes for sale was down 6.4% from a year ago, to the lowest level since the NAR started tracking these statistics. Ever. In history.
Sigh….
Share this:
Thus Spoke Janet
Yeah, who else tried to slug their way thru Thus Spoke Zarathustra back in their halcyon days? Now that the storms of autumn breath over my career, I find the pronouncements of Janet Yellen every bit as obtuse as Nietzsche.
I’ll try to make it simple. CNBC had an excellent piece this afternoon. If you borrow money, you’re going to pay more. If you invest in debt instruments, you’re not going to get paid more. Simple?
So what does this mean for real estate? I’ll posit a few axioms.
- If you have a home equity loan and a first mortgage, and you have positive equity, you need to rush to your friendly banker and refinance all that into a fixed rate loan before happy hour this evening.
- If you’ve been planning to buy a house with a loan (as most people do) then yesterday was the day. Today maybe. Tomorrow… eh…..
- If you can invest in rental property, look for “equity positive” locations. These are cities with solid economics, but the cost of construction is disconnected to the local rental rates. Existing rental houses sell for a discount to new construction. Buy all you can grab.
- There are three different explanations for the shape of the yield curve — rational expectations, debt stratification, and liquidity preference. Today, liquidity preference trumps the other three.
Share this:
How many homes do we need?
It is HARD to keep up with a blog when the news seems to move out from under you every day. Now that the election is over, we can get back to normal stuff, like how’s the economy doing and where do we go from here.
Back on the campaign trail, ONE of the presidential candidates (HE will remain nameless) complained about the level of home ownership, which hit the “lowest level” in 50 years or so. Admittedly, that’s true, but also a bit misleading. Since the peak — which led, by the way, to the recent mortgage melt-down, home ownership in America declined from 69.2% (June, 2004) to 62.9%% (June, 2016). That’s not a huge decline, but indicative of just how sensitive our economy is to the level of home ownership. I’ll be the first one to admit (and in my early days, I did more than a bit of research on this) that lots of good things eminate from new home construction and from the home brokerage business. For one, there are a lot of good jobs at stake — from skilled carpentry to mortgage lending and everything in-between. I’ll also note that there have been many studies thru the years focused on the social benefits of home ownership, which add to neighborhood quality, school quality, and even reduced crime levels.
That said, most good things come in “optimum” levels. For example, eating a well balanced diet is superior to either starving or binge eating. Human bodies are optimized for a temperature of 98.6F, and will die if internal temps are sustained even a few degrees on either side. Not enough water and you die, and yet people drown each year from too much. See the connection?
Home ownership would not have hit record levels without lending practices that were neither healthy nor sustainable. We don’t know exactly what the optimum level of home ownership in the U.S. economy might be, since the economy is anything but static. However, right now, the economy seems to be chugging along quite nicely with current home ownership levels. Are we at a sustainable optimum? Perhaps, but only time, and stable economic policies, will give us some empirical data.
Share this:
PWC’s Emerging Trends in Real Estate for 2016
Ever since PWC acquired Peter Korpacz’s excellent quarterly commercial real estate survey, they have really leveraged that theme into a great regular read. Along with my subscription, their annual Emerging Trends just landed in my in-box, and it’s a really excellent read. (To access a copy, just click on the link above.) The report is a must-read for anyone in real estate, particularly in the investment or finance side. I’ll skip to two of the summaries — one they call “expected best bets” as well as the capital market summary, to give you a flavor of their report.
Expected Best Bets — PWC recommends, “Go to the secondary markets”. They note that gateway markets have pricing problems, while the “18-hour cities” are “…emerging as great relative value propositions.” They particularly cite Austin, Portland, Nashville, and Charlotte.
PWC also discusses “middle-income multifamily housing,” and notes the solid business opportunities providing creative answers for what they call the “excluded middle” households. PWC also encourages planners to re-think parking needs, in light of the changing demands of “live/work/play downtowns.”
On the securities side, PWC notes that many REITs are priced well below net asset value, providing an interesting arbitrage opportunity in 2016.
Capital Markets — PWC opens by noting, “In many ways, it appears that worldwide capital accumulation has rebounded fully from the global financial crisis. The recovery of capital around the globe has been extremely uneven. And the sorting-out process has favored the United States and the real estate industry, affecting prices, yields, and risk management for all participants in the market.”
Whew…. I’m usually loathe to quote so much from another’s work, but I simply could not have said that any better. PWC quotes one of their survey respondents, a Wall Street investment advisor, who says, “There is going to be a long wayve of continued capital allocation toward our business….”
Survey respondents largely were split on short-term inflation, with about 40% predicting modest increases and 60% looking for stability at current rates. However, when they look down the road 5 years, 80% of respondents look for modest increases in inflation. Coupled with that, over 60% of respondents think both short term interest rates and mortgage rates in specific will rise next year, and nearly 80% think such rises will occur over the next 5 years. Intriguingly, a small but significant minority — about 20%, believe rates will rise substantially over the next 5 years. Almost no one believes rates will fall, either in the short-term or the long-term.
To sum up the capital markets view, PWC says the general spirit of the industry is positive, albeit with an eye toward risk. Many are calling for a “long top” to this recovery, but many are also taking defensive postures by shortening investment horizons, paying more attention to the income component of total return rather than the capital appreciation component, and moving down the leverage scale.
As always, I would stress that I am citing a 3rd party source here, and nothing in this review should be construed as investment advise. That said, PWC’s Emerging Trends is an excellent read, and I highly recommend it.
“5 Economic Trends to be Thankful For”
First, I hope everyone had a great Thanksgiving! For those of you who in countries that don’t share our festival of thanks, I hope you had a great Thursday!
Kuddos to Neil Irwin, writing in the Washington Post yesterday. I agree 100% with his list, and wanted to reproduce it here:
1. Household debt is way down. Neil lists this as his first item, but I would suggest it has plusses and minuses to it. On the plus column, we really WERE over-debted as a society. On the minus side, changes household debt carries with it complex implications for the consumption side of GDP, as well as corporate investment (see my prior blog post) and even trade relationships. Nonetheless, this is, on net, a good thing.
2. The cost of servicing that debt is way down — as Neil points out, from 14% of disposable income in 2007 to 10.7% today. Of course, remember that one person’s interest EXPENSE is another person’s interest INCOME. Nonetheless, this constitutes a significant wealth transfer from people who HAVE money back to people who NEED TO BORROW money.
3. Electricity and natural gas prices are falling. It’s hard to find a downside to this one. From last year, consumer natural gas prices are down 8.4%, and electric rates are down 1.2%. I would add to Neil’s analysis that more of this money is staying at home — the U.S. is well on its way to being import-neutral on energy. Of course, this has some geopolitical implications, which we’ll deal with on another day.
4. Businesses aren’t firing people. While unemployment remains high at 7.9%, at least the arrows are pointed in the right direction.
5. Housing is dramatically more affordable. Neil points out that in 2006, the typical homebuyer faced a payment equal to 41% of the average wage of a private-sector worker. Today that’s 26%. This is a combination of both lower house prices (which proportionally lowers down payment requirements) and lower mortgage interest rates.
Congrats to Neil Irwin and the Washington Post for an insightful and timely article!


