Archive for the ‘Real Estate Investments’ Category
Back again!
I’ve been gone for over a month, but hopefully not forgotten! One of the big stories around Greenfield has been the continues soft-launch of our REIT Fund-of-Funds, ACCRE. We’re rolling this out as a subscription-based newsletter, rather than an actual managed fund. However, non-subscribers wishing to follow our progress can simply tune into the blog itself, ACCRE.Com, and follow our periodic posts, but without access to the actual fund itself:
www.accre.com/2018/11/fund-status-for-october-2018/
Share this:

REITs vs Open Ended Funds
There is a great article in the current edition of REIT Magazine, by Michele Chandler, celebrating the 25th anniversary of the creation of REITs in Canada. Ms. Chandler does a great job explaining why Canada has a REIT system in the first place, and why Canada’s REITs came into being in 1993.
In short, Canada’s commercial real estate market collapsed in 1993, and open-ended funds were flooded with investors redeeming shares. The funds quickly appealed to the government which allowed them to suspend redemption. This, of course, led to liquidity problems for investors. The solution was to turn those funds into close-end REITs which would then be listed on the Toronto Stock Exchange. Investors could sell their shares on the exchange to gain liquidity. Today, the exchange has 38 Canadian REITs with total capitalization of about C$57.7 Billion as of the end of 2017.
This article illustrates one of the subtle but important benefits of REITs as opposed to a private equity fund or an open-ended fund — liquidity without having to sell off the underlying assets in a down market.
Share this:
Inflation outpacing wages. Fed expectations?
Those of us who lived through the 1970’s may think that 3% or 4% inflation is childsplay, but the FED doesn’t necessarily look at it that way. Indeed, they’re an “inflation conservative” bunch, and don’t take too kindly to the CPI heading northward.
An article this morning in CNN Money offers two painful scenarios. First, inflation is nudging up, in no small part from housing costs and health care costs. Add to that the impending impact of the coming Trade War, and the news isn’t very good.
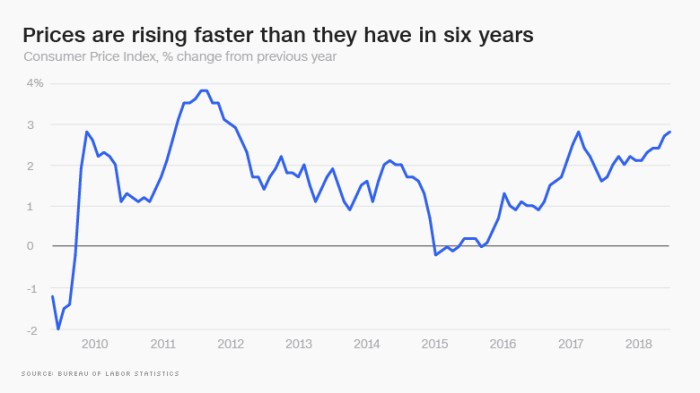
Graphic courtesy money.cnn.com
Second – and we’ve been predicting this – consumer prices are rising higher than wages. The difference isn’t very big at the median, only 0.2 percentage points, but given the disparate increases in incomes in America of late, and the disparate consumptions patterns, this means that the burdens of cost inflation are being disproportionately felt by working families.
More to come….
Share this:

Commercial property prices
First, a happy 4th of July to all of our U.S. readers! I’ve spent the day catching up on reading, writing, and napping. I hope you’ve all done the same.
Part of my reading was a recent piece by Calvin Schnure for the members at NAREIT titled Commercial Property Prices Continue Steady Gains. It’s an interesting read, and factually correct. However, Mr. Schnure and I might arrive at somewhat different conclusions. Case in point is illustrated by the graphic below, taken from his article:

Now, if you are running a REIT and want to convince potential investors that the world is rosy, then this is a very pretty graphic. On the other hand, if you are a real estate analyst (ahem…. please hold your applause) you have to wonder what the heck is going on here. I’m particularly concerned with multi-family, which has increased in value on the order of about 60% since the previous peak (December, 2007) but is up by something close to 160% since the trough of 8 years ago. Yeah. That’s a huge run-up. Couple that with the observations (anecdotal, at present) that multi-family vacancies are on the rise nationwide, and particularly, surprisingly, in formerly hot markets like Seattle (just to name names).
I’m not preaching a long-term or even intermediate term demise for multi-family. Far from it, in the long term, these are still worth considering. However, in the short-term, these annualized gains may not be sustainable.
By the way, there’s a lot more in the NAREIT article, and it’s worth reading in its entirety.
Watch this space. We’ll keep you posted.
Share this:

And yet more on housing
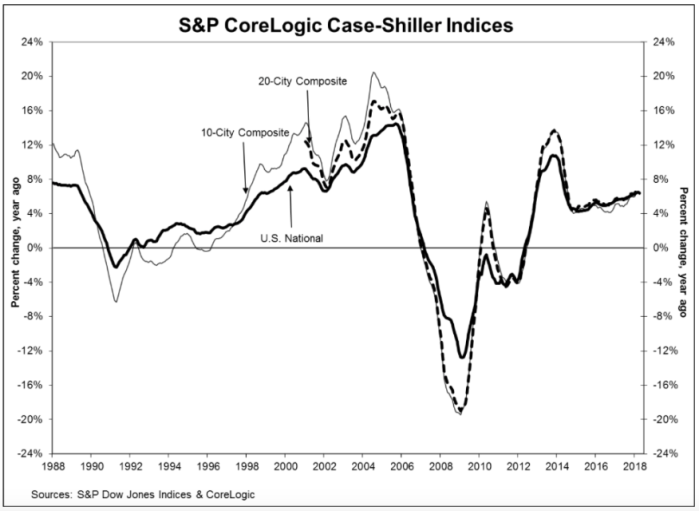
Twice burned, you know? I think we should all be a bit gun-shy about rapidly increasing house prices. Are we looking for a bubble or a peak?
The S&P CoreLogic Case-Shiller U.S. National Home Price NSA Index, reported a 6.4% annual gain in April, slightly down from an annualized rate of 6.5% in March. While they produce a few other indices, all of them basically report the same thing. Oh, by the way, my home city of Seattle leads the pack with an annualized rate north of 13%.
Glancing at the graphic, below, the slope of the current pricing graph looks suspiciously like what we saw during the bubble run-up. As I’ve noted here previously, house prices increasing at a rate higher than 2 points over inflation is emblematic of a bubble. That would suggest a nationwide rate somewhere around 4% – 5% right now. You do the math.
Share this:

Collapsing Price of Alternative Energy
Most — nearly all — of our work is in real estate, but energy has a huge real estate component, so major shifts in the energy market have significant implications for real estate investment.
A recent report out of Lazard reflects just such a major shift. Specifically, among five major sources of energy, wind and solar are now the low-cost alternatives. Indeed, since 2009. the cost of solar energy (at a utility scale — not just what’s on the roof of your house) has declined by 86% to about $50 per megawatt hour. Coal, for example, has declined in price only 8% during that period, and is now $102/MWh, or double the cost of solar. Wind is even cheaper, at $45/MWh.
Thanks to Lazard for the accompanying graphic.
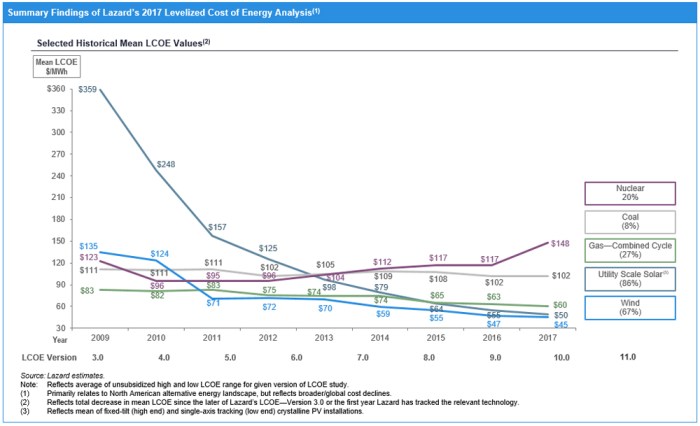
The implications for real estate are obvious. If and as utilities shift supply sources, and focus on alternative energy to meet increasing demands, there will be an accompanying demand for solar farms, wind farms, and new transmission lines. Accompanying this, we’ll probably see a decreased utilization of coal mines, and certainly a reduced demand for new coal mines.
Share this:

Commercial Real Estate — Prices vs Values
Anyone involved in real estate knows that commercial prices and values have been on a constant uptick since the trough following the recession. The very length and breadth of the recovery has caused nervousness among investors, appraisers, and lenders. Today, I’m looking at two somewhat disparate views on the subject.
First, Calvin Schnure, writing for NAREIT, looks at four measures of valuation:
- Cap rates and cap rate spreads to Treasury yields
- Price gains, either from increasing NOI or decreasing cap rates
- Economic fundamentals, such as occupancy and demand growth
- Leverage and debt growth
At present, none of these is giving off warning signals, according to Schnure. Cap rates continue to be low compared to other cycles, but so are yields across the board. There continues to be room for cap rate compression, in Schnure’s assessment. As for price changes, every sector is showing growing or at least stable NOI, with the proportion of price changes coming from NOI now equal or exceeding price increases coming from cap rate declines. Across the board, REIT occupancy rates are high and on the rise, with industrial and (surprisingly) retail at or near 95%. All equity REITs are in the low 90% range, compared to the high 80’s at the trough of the recession. Finally, debt levels are rising, but at a lower rate than valuations. Ergo, this is not, in his opinion, a debt-fueled cycle. Right now, debt/book ratios are significantly lower than in the previous FOMC tightening cycle (2004-2006). For a full copy of Schnure’s article, click here.
Second, I was at the American Real Estate Society’s annual meeting in Ft. Myers, FL, last week, and had the great pleasure to sit in on a presentation by my good friend Dr. Glenn Mueller of Denver University, the author of the widely acclaimed Market Cycle Monitor. He tracks property types and geographic markets by occupancy, absorption, and new supply statistics, and for years has proffered a very accurate measure of commercial real estate, both nationally and locally, across four potential phases:
- Recovery (rising, although unprofitable rents and occupancy)
- Expansion (rising and profitable rents and occupancy, stimulating new construction)
- Hypersupply (oversupply of new construction and declining rents and occupancy)
- Recession (unprofitable and declining rents and occupancy)
Most markets cycle through these phases in a fairly predictable fashion. Right now, most markets (property types and geography markets) appear to be in the expansion mode, with some (notably, apartments) potentially crossing the line into hypersupply.
In short, commercial real estate markets look healthy, absent the sort of exogenous shocks that sent us into the most recent recession. That said, many of those same metrics read positive prior to the mortgage market melt-down. Of course, commercial real estate actually faired pretty well during the recession, compared to many other asset classes, supporting the notion that in times of economic trouble, real estate equities can be great storers of value.
Share this:
Damage to Reputation/Brand
In my last post, I commented about AON’s Global Risk Management Survey. I want to continue on that theme today, and continue to compliment the great folks at AON for a super job.
Number one on their list was Damage to Reputation / Brand. The open the chapter on that with a wonderful story, which I will briefly retell here (with full attribution). A worker in China purchased an electronic device and while charging it, the device caught fire. He videotaped the incident and uploaded it to the internet. The clip was soon viewed millions of times around the world. Other customers reported similar defects. Even though less than 0.1% of the devices sold were defected, widespread panic followed. the company was forced to issue a world-wide global recall costing an estimated $5 Billion. Ironically, this tech company became a victim of the tech revolution.
AON notes that widespread fake news, the lack of fact checkers on social media, and the political cross-fire following the US 2016 elections all have risk for brand damage. AON estimates that there is an 80% chance a company could lose at least 20% of its equity value in a month over a 5 year period doe to a reputation crisis.
Eight years earlier (2009), Damage to Brand / Reputation was ranked number 6 among risks by respondents. Today it is number one. Reputation / Brand events often arrive with little or no warning, to cite the survey, and organizations are forced to respond quickiily. As such, it is critical that companies have comprehensive reputation risk control strategies in place. Such strategies include meticulous preparation and executive training, to help maximize the probability of recovery.
Thanks again to the good folks at AON for providing this information.
Share this:
AON’s Global Risk Management Survey
The good folks at AON just shared with me their very detailed Global Risk Management survey for year-end 2017. It’s a terrific document, very thoroughly researched, and I commend them for the effort they put into this. (Full disclosure – neither I nor Greenfield, nor any of its affiliates, have any interest in AON.). This is the sort of study that should be on the desk of every CEO who has globally-affected interests, and certainly real estate and private equity fall into that category.
The document is chock-full of good stuff, and I’ll revisit this in future posts. Two interesting comments, however, hit me right up front. First, and I’ll simply quote from the survey, “…developed nations, which were traditionally associated with political stability, are becoming new sources of volatility and uncertainty that worry businesses…”. Of course, they’re taking about the U.S. and its misguided trade war, BREXIT, the elections in Northern Europe, and the impeachment of the South Korean president.
Second, what are the top concerns for global businesses and wealthy families? The list may come as a surprise to those who don’t follow these important sectors, but these certainly make sense in today’s climate:
- Damage to reputation/brand
- Economic slowdown / slow recovery
- Increasing competition
- Regulatory / legislative changes
- Cyber crime / hacking / viruses / malicious codes
- Failure to innovate / meet customer needs
- Failure to attract or retain top talent
- Business interruption
- Political risk / uncertainties
- Third party liability
I can tell you Greenfield is deadly serious about these issues. You should be, too.
Share this:
So, folks, where are we going to live?
Much has been said recently about housing starts being back up to where they were before the recession. If this is the case, then why does Seattle, for example, have a 0.9 month supply of homes for sale? As usual, the details are much more complicated than the headlines.
Prior to the “meltdown” (let’s say, 2004 – 2007), housing starts in the U.S. averaged about 1.865 million units per year. Now, few analysts disagree that this was too many, but figuring out the right number is harder than one might think. In 2008, the number dipped down to about 905,000, and hit a low of 583,000 in 2009. Since then, the annual starts have trended up. However, in 2016, we still were only at 1.207 million. Of that, only 751,000 were single family units, compared to an average of 1.4 million single family homes per year in the 2004-2007 period. Hence, nationally, we’re building about half as many homes as we were 10 years ago.
From 2004-2007, we started 7.462 million dwelling units in America, but in the past four years we’ve only started a total of about 4.432 million (all varieties). That’s a shrinkage of about 3 million new homes, and most of that shrinkage is in the single family category.
One might posit that the decline in home ownership rates should have freed up some demand, and some of that’s true. The home ownership rate in America peaked at 69% during the run-up to the recession, and dropped steadily after the melt-down, to a low of 62.9% in the 2nd quarter 2016. As of the end of the 3rd quarter this year, it sits at 63.9%, or about 5 points below the peak of a decade ago.
There are about 76.146 million owner-occupied housing units in the U.S. today. A five-percent swing in this number is a little over 3.5 million houses. In short, we’ve now “absorbed” the decline in starts, and structurally we’re more-or-less “over” the recession, and we’re simply not building enough new homes to meet the demand.
Several consequences came out of the melt-down. First, developing land takes quite a few years — five or more in the “hot” areas like Seattle, where land has to go thru a permitting and entitlement phase long before a house can be built. All of this requires land planners, both in the private sector and downtown at the county or city hall. Many of these folks lost their jobs during the 2008-09 period, and indeed some county and city planning offices were eviscerated. New home development frequently requires a significant outlay in public infrastructure, including schools, roads, and utilities. Worse than that, many construction trades were gutted, with no replacements available. Financing for acquisition, development, and construction is now problematic (although, arguably, it was too liberal pre-recession).
As such, it’s a sellers market for homes, and in hot markets, buyers compete by bidding up prices beyond reasonable levels. Some pundits are nervous, and with good reason.
(Thanks to the U.S. Census Bureau for the October 31 data.)


