Posts Tagged ‘Case Shiller’
And yet more on housing
Twice burned, you know? I think we should all be a bit gun-shy about rapidly increasing house prices. Are we looking for a bubble or a peak?
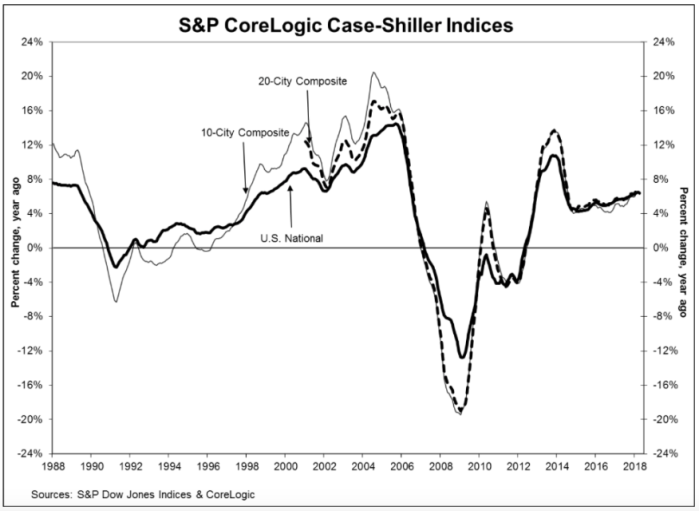
The S&P CoreLogic Case-Shiller U.S. National Home Price NSA Index, reported a 6.4% annual gain in April, slightly down from an annualized rate of 6.5% in March. While they produce a few other indices, all of them basically report the same thing. Oh, by the way, my home city of Seattle leads the pack with an annualized rate north of 13%.
Glancing at the graphic, below, the slope of the current pricing graph looks suspiciously like what we saw during the bubble run-up. As I’ve noted here previously, house prices increasing at a rate higher than 2 points over inflation is emblematic of a bubble. That would suggest a nationwide rate somewhere around 4% – 5% right now. You do the math.
Share this:

Housing equilibrium — part 3
The Economist is simply the most informative magazine in the world today. If I came out of a coma, I’d want it as the first thing I read. One issue, and I’d feel fairly well caught up. The on-line version is an extraordinary supplement to the print edition, and may very well be a one-stop shop for economic research.
With all the obvious sucking-up out of the way (and no, I don’t get a free subscription — I pay for mine just like everyone else), the current issue has a stellar article titled “Suspended Animation” about America’s Housing Market. In prior missives on this blog, I’ve drawn linkages between the home ownership rate (currently at about 66%) and the housing bubble (best visualized with the Case-Shiller Index). The article makes that same comparison, without drawing the conclusions I do (see below).

When visualized this way, the linkage becomes fairly clear and obvious. Nonetheless, the real question is “where is the bottom”. There is significant anecdotal evidence to suggest we may be closing in on it right now, but then again, there’s some evidence to the contrary. On the plus side, a LOT of speculative cash is entering the marketplace right now, and about a quarter of all home sales in America are cash-only (see the front page of the February 8, 2011, Wall Street Journal). More interestingly, in the hardest-hit places, such as Miami, this percentage is approaching 50%. From a pure chartist perspective, we note that the C-S index has been “hovering” around 2003 prices for several quarters now. Back in my Wall Street days (LONG before the movie of the same name), the technical analysts would talk about “bottoms” and “breakouts” and such. Of course, residential real estate is not a security, per se (although mortgages are), and the comparisons fall apart at the granular level.
On the down side, the Fannie Mae/Freddie Mac controversies continue to simmer. The Obama Administration and the Republicans in Congress are finding common ground hard to find. The “Tea Party” Republicans want the government out of the home lending business entirely, which means privatizing the F’s. This idea is getting no traction at all among the Realtors and the Homebuilders, two typically “Republican” groups who generally sound like Democrats on this issue. One might blame this on grid-lock, but these are fundamental issues regarding the government’s role in the housing market which date back to the Roosevelt administration. Congress — both Republicans and Democrats — emphatically wanted to goose the home-ownership rate over the last twenty years, and empowered the F’s to do that. After that, the Law of Unintended Consequences got us where we are today. Now, in the words of Keenan Thompson on Saturday Night Live, everyone wants congress to “just fix it!” but with no solution in sight. Until this gets “fixed”, house prices will, at best, probably bounce along where they are today.


