Greenfield’s Manufacturing Research Partnership
A really big “shout out” to Dr. Cliff Lipscomb and all of our economic research team, who have inked a partnership with the U.S. Department of Commerce, the National Institute for Science and Technology (NIST) and Georgia Tech to investigate NIST programs in manufacturing. Following is the text of the press release, which is also featured on a number of web sites, including RICS-Americas (http://tinyurl.com/7h2summ):
Greenfield Advisors and Georgia Institute of Technology to Evaluate the NIST MEP
November 15, 2011
ATLANTA, GA –The Hollings Manufacturing Extension Partnership (MEP), a program of the National Institute of Standards and Technology (NIST), is a nationwide network of manufacturing extension centers that provide services to small and mid-sized manufacturers to increase their competitiveness and productivity. Since 1989, the MEP has worked with manufacturers to provide cost-effective expertise and assistance to improve their manufacturing processes, to provide workforce training, and to implement new technologies. The MEP also focuses on supply chains, providing growth and innovation services to firms. Approximately 7500 client firms are served annually.
Many stakeholders view the primary mission of the MEP as materially improving the long-term viability of US manufacturing. To meet this mission, MEP must demonstrate persistent, long-term improvement in client performance. In addition, the U.S. Office of Management and Budget (OMB) has asked federal programs to make decisions regarding assessments of program performance based on evidence. Recently, the U.S. Department of Commerce awarded Greenfield Advisors and the Georgia Institute of Technology $249,000 to evaluate the effects of the MEP program. In this work, we will be evaluating the economic performance and survival of U.S. manufacturing firms, comparing the outcomes of MEP clients to nonclients, controlling for other factors. Our focus will be on establishments that received MEP services between 1997 and 2007. We will estimate the effect of different levels and types of MEP services on output and productivity growth over this period. The novelty of our approach is the econometric methods we will use to find the determinants of economic performance and survival of MEP clients while adequately controlling for selection bias.
Greenfield Advisors’ partner in this research is the Georgia Institute of Technology. Dr. Jan Youtie, Manager of Policy Services and Principal Research Associate at Georgia Tech’s Enterprise Innovation Institute, commented “the MEP is an important program targeted specifically for manufacturing. We are excited to work with Greenfield Advisors on this important evaluation of the effect of program services on manufacturing performance and survival.”
The MEP evaluation will take approximately 1 year to complete. Greenfield has assembled a blue-ribbon Technical Advisory Group (TAG) to consult on the development of the research and provide guidance as necessary. Members of the TAG include former and current chief economists within the U.S. Department of Commerce as well as other well-known economists at the U.S. Census Bureau and the University of Texas at Austin. You can learn more about the MEP at http://www.nist/gov/mep.
Share this:

Google’s real estate index
Yeah, me neither….
I was doing a search for some real estate stats today, and happened upon the neatest little toy — it’s Google’s index of real estate searches, which you can access via: GOOGLEINDEX_US:RLEST. According to the gurus at Google, it tracks queries to “real estate, mortgages, rent, apartments, and so forth.” Also, according to them, you can use it to compare to real estate investment indices.
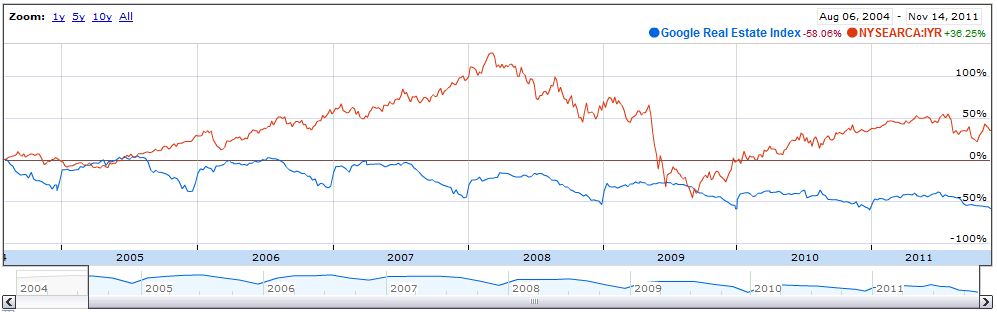
Having SOOOOOOO much spare time on my hands (my colleagues here at Greenfield are shuddering at that), I decided to give it a test. I downloaded the index’s raw data for the last 7 years (believe it or not, you can do that), and then downloaded the iShares Dow Jones Real Estate pricing data for the same dates. A little manipulation was in order, because Google gives data for 7 days a week, but of course the stock market is only open 5, and then not on holidays and such. The difference (about a 1000 days) I made up by simply taking the closing prices on Friday and spanning that over the weekend. You get the picture.
The graphic looks like this:
courtesy: Google Real Estate Index and iShares Dow Jones U.S. Real Estate
Not being one to settle on graphics, I then ran a correlation examination on the two indices. Guess what? Yeah, nothing. To be specific, I get a correlation coefficient of 29.6%, which is fairly close to meaningless. This dog don’t hunt, as they say.
Oh well, sometimes it’s fun to find out what DOESN’T work. In short, the volume of Google searches on real estate may have some interesting insights buried deep within it, but I don’t see it yet.
Share this:

Philadelphia FED Survey
My “touchstone” for economic forecasting is the quarterly Philadelphipa FED Survey of Professional Forecasters. They survey about 50 or so forecasters each quarter representing the top forecasting “shops” in the country. (The number isn’t exact, because many of the forecasters wish to remain anonymous.) Included in the mix are the usual suspects — Mark Zandi from Moody’s, Ethan Harris from BofA, Dean Maki from Barclays, Ardavan Mobasheri from AIG, Sean Snaith of U. Central Florida, and so forth. I mention these names as examples to demonstrate these are folks who span the broad array of economic perspectives, and who usually represent firms that are actually putting their “money where their mouth is.”
An additional strength of this survey is methodological — the Phily-FED reports not only the mean of the responses, but also the distribution of those responses. Thus, it’s very helpful to see when individual forecasts are highly coalesced around a central tendency, or if there is a great degree of dispersion in the estimates.
Bottom line — the current projections for 2012 and 2013 are now weaker than they were three months ago (in the previous survey). While a double-dip recession doesn’t appear to be in the offing, the panelists expect real GDP growth to end up at 1.8% for 2011, 2.4% in 2012, and 2.7% in 2013. While 2011 will end slightly rosier than previously forecast, the numbers for out-years are about 0.2% lower than previously expected. The outlook for 2014 is also less than previously expected.

Courtesy Philadelphia FED Quarterly Survey of Professional Forecasters
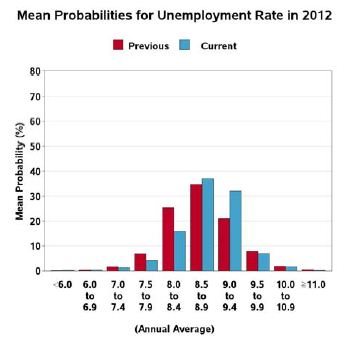
These downward revisions in GDP growth come primarily from “…upward revisions to unemployment and downward revisions to job growth.” Specifically, unemployment is expected to end this year right at 9.0%, and is expected to fall to 8.8% next year, 8.5% ini 2013, and 7.8% in 2014. The prior survey had a fair amount dispersion in estimates for end-of-year 2011 unemployment, with over 30% of respondents optimistically thinking that unemployment could end the year between 8.5% and 8.9%. That number has now dropped to about 20%, and about 75% of respondents now believe that unemployment will end this year between 9.0% and 9.4%.
Courtesy Philadelphia FED Quarterly Survey of Professional Forecasters
Intriguingly, the central tendency of next year’s forecast didn’t change much from the last survey to this one, with between 30% – 40% of respondents thinking that unemployment would hover between 8.5% and 8.9% next year. The real change in the forecast came in the next-lower and next-higher brackets of estimates, which nearly reversed themselves from last survey to this survey. A quarter ago, about 25% of respondents thought that unemployment would end up around 8.6% in 2012, and only about 20% projected 9.2%. Today, only about 15% forecast the lower range, and about 32% are opting for the higher range.
Finally, while forecasts of inflation over the next ten years is still nearly flat-lined around 2.5%, there have been slight up-tics in forecasts ever since mid-2010. The following chart shows the general sentiment among forecasters, as well as the “track” of their forecasts over the past 20 years, which as you can see is pretty neatly distributed in a tight range. In general, inflation has not been a major issue in over a decade, but it is still worth tracking.

Courtesy Philadelphia FED Quarterly Survey of Professional Forecasters
Share this:

Now for a little good news….
Globe Street has a great piece about the self storage market, which is doing very nicely lately. Top firms in the fiele had revenue growth of 4% to 5.8% in the 3rd quarter, with net operating income growing 7.3% to 8.6%. ranged as high as 91.7% at Public Storage. The article properly notes that this sector is now joining apartments in strong, positive territory. Overall REIT share performance, as noted in the chart below, certainly underscores this (YTD as of October 2011, data courtesy NAREIT).
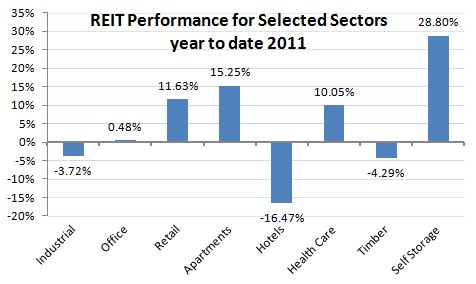
While the article correctly notes the strength in this market segment, it doesn’t connect the dots vis-a-vis why. Some of this is obvious, but it bears noting due to the very signficant long-range implications. The more-or-less simultaneous strength of the apartment sector and the self storage sector isn’t coincidental — the popularity of apartments for households which WOULD HAVE been in the owner-occupied housing market is driving the need for self storage. Anecdotal evidence of late suggests that the trend is toward smaller apartments — studios, efficiencies, and one-bedrooms seem to be in higher demand lately, although I haven’t seen this formally quantified as of yet. Given that, not only is there a need for self-storage, there will also be an increased need for SMALLER self-storage units as opposed to larger ones, urban infill units (or at least units near apartment communities) and even self-storage as an adjunct to apartment communities themselves.
Long term? This market risks getting over-build whenever the housing market stabilizes. However, that seems to be several years out. In the intermediate term, one would suspect a strong demand for more units paralleling the demand for apartments.
Share this:

And yet another post about housing
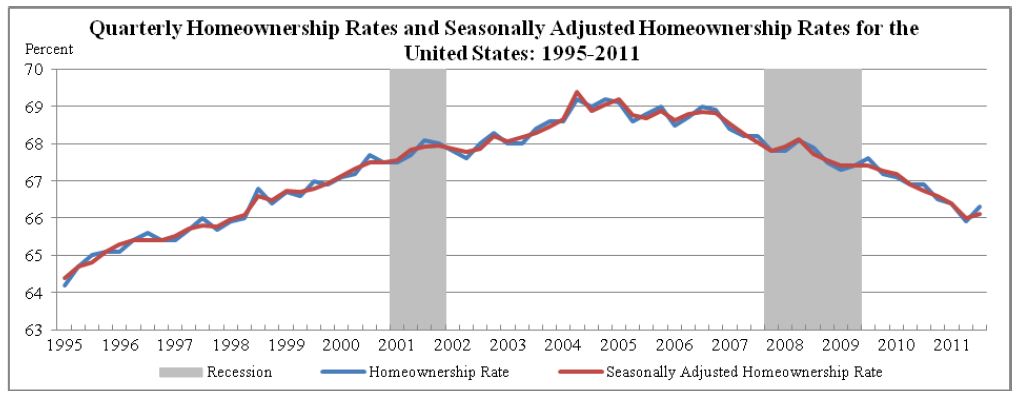
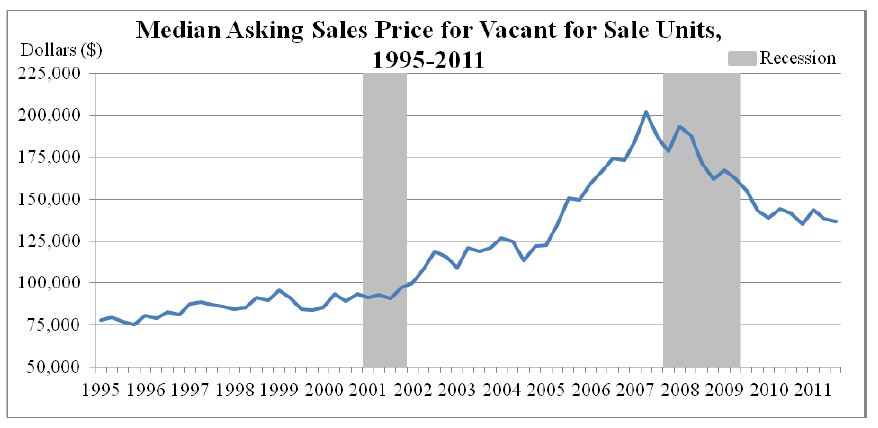
With all the negative news about housing, the market may have a tendency to grasp at any straw that floats along. In today’s news, that straw is a report from the census bureau that home ownership rates — which have been declining steadily for two years, and are now at a 13-year low — seemed to reverse trend in the 3rd quarter and rise by 0.4% to 66.3%.
courtesy U.S. Census Bureau, 11/9/11
Of course, a quick read of the footnotes belies the problem with this pronouncement. First, as you can see, there’s a fair amount of cycling around long-term trends, and that’s probably what this is. Second, on a seasonally adjusted basis (which is really where the truth can be found), the increase was only 0.2%, which is statistically insignificant. Further, on a year-to-year basis, we’re still lower than where we were a year ago, which really underscores the long-term trend. I continue to believe that ownership rates will stabilize somewhere above 64%, but probably pretty close to it. At the current trend, that may take 3 – 5 years.
More importantly, though, an increase in housing demand (and prices) led us out of prior recessions, but housing is continuing to be a drag on the market following this most recent one. Unless and until the housing market doldrums stabilize, solid economic growth will elude us.
courtesy U.S. Census Bureau, 11/9/11
Share this:

Housing redux
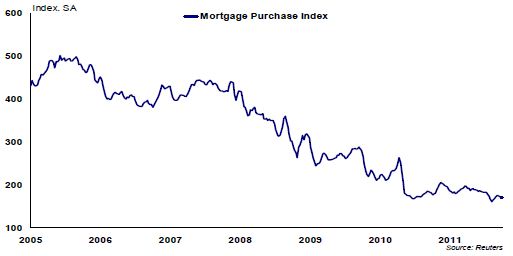
While I’m on the subject, the Royal Instition of Chartered Surveyors (RICS), of which I’m a Fellow, publishes a great . Last week’s edition had a piece on the U.S. housing market doldrums, with a particular emphasis on the dearth of mortgage purchases (the secondary market which is vital to the liquidity of the mortgage business).
As you might guess, this important segment of the market peaked in 2005/6, and with a brief attempt at pick-up in early 2008, has been on a downward slide ever since. The index currently stands more than 60% down from the peaks of just 5 years ago. The trend continues downward, and fell 3.5% in the third quarter of this year.
Mortgage Purchase Index
They note that residential investment as a percentage of GDP currently stands at 2.2%, down from pre-recession levels of 6.6%. What’s more, the excess supply overhang will take years to absorb, according to their analysis.
The health — or lack thereof — us currently a front-burner issue for the Federal Reserve, which is now looking at the mortgage bond market as a means of helping to stimulate this anemic sector. Both FRB member Daniel Turillo and Vice Chair Janet Yellen have made public pronouncements in that direction recently.
Share this:

The housing market — Damning with faint praise
Sorry we’ve been absent for so long — it’s been a terrifically busy summer and early fall here at Greenfield. Hopefully, we’ll be back in the saddle more frequently for the rest of this year.
From an economist’s perspective, there’s plenty to talk about — Euro-zone debt crisis, job growth (or lack thereof), Federal and state debt, etc., etc., etc. My own focus is the mixed-message on the housing market, which continues in the doldrums. If you listen to the reports from the National Association of Realtors, you get some positive headlines followed by fairly depressing details. Existing home sales are better than forecasted, mainly due to great borrowing rates and the influx of “investor-buyers”. Lots of single family homes and condos are being turned into rental property or held “dark” for the economic lights to come back on. A surprisingly large number of homes are purchased for all-cash, since if you believe that housing prices are near their bottom, then residential real estate may be more stable — and potentially have better returns — than equities.
On the other hand, new home sales continue to languish at their lowest levels since we started keeping score in 1963.
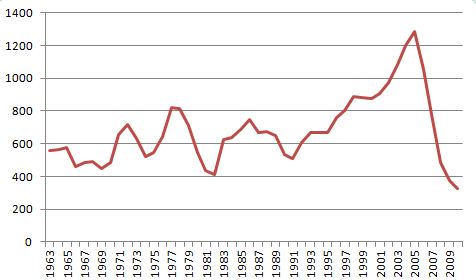
Intriguingly, if you ignore the post-2003 “bubble” period, and trendline the data (which grows over time, to account for the increasing population), you end up with about 900,000 new home sales in 2011. As it happens, we’re actually around 300,000, reflective of a significant decline in home ownership rates — now down to about 66%.
The real question is whether or not this change in home ownership rates is temporary or permanent. We happen to think it’s permanent. That’s not all bad news, but it means that when new home sales come back on-line (eventually getting back to somewhere short of 900,000, but certainly higher than 300,000), we won’t see a return to bubble-statistics.
Share this:

Allison versus Exxon
If you follow the litigation news, you’re probably aware that this past week, a state-court jury in Towson, MD, awarded a group of plaintiffs $495 million in actual damages plus about $1 Billion in punitives in the mass-tort matter of Allison v. Exxon. The facts of the case are pretty straight-forward: Exxon leaked a significant amount of MTBE-laden gasoline into the drinking water aquifer of an unincorporated suburban Baltimore community known as Jacksonville.
I was the sole damages expert testifying for the plaintiffs, and methodologically, this was one of the more intriguing cases in my career. We utilized a mass-appraisal hedonic model for my determination of the unimpaired value of the properties as of February, 2006 (the date of the spill) and then amended this model to add factors for the impact of the contamination on these property values (using contingent valuation, meta-analysis, and case studies in the absense of a well-functioning transactional market). We also developed business loss determinations, loss of use-and-enjoyment measures, and present value calculations for medical monitoring costs.
Exxon literally threw everything they had into the damages aspect of the case — they knew this case had the potential to be both big as well as precedent-setting. They hired a veritable battalion of big-named appraisers, professors, modeling experts, and consultants, and one of their two damages testifying experts was a hold-over from the Exxon Valdez case. The multiple days of deposition, motions-in-limine hearings, and trial testimomy (and cross examination) were among the toughest I’ve ever seen.
Naturally, I’m always pleased when my clients win, but not for the reasons people tend to think. I’m not in this for the “win or lose” part of it, but it is intellectually challenging to climb these sorts of mountains, and when a court agrees with me, I’d be disingenuous to say it’s not intellectually affirming.
I’ll be developing a white-paper on this case very soon, and by some coincidence, I’m slated to speak in Manhattan at the semi-annual meeting of the American Academy of Justice next Monday on the topic of “Use and Enjoyment Damages”. As you might guess, this case will be featured in that talk — and probably plenty of subsequent ones.
Share this:
CNBC reports on housing doldrums
Diana Olick is the real estate blogger/reporter for CNBC, and has a great column this week commenting on the recent “semi-good-news” from CoreLogic. For her full column, and links to the CoreLogic report, click here.
The synopsis — CoreLogic reports that foreclosure sales as a percentage of total sales are down. Great news, if it wasn’t for the sad fact that distress sales in May were still at 31% of the total market, albeit down from 37% in April.
Ms. Olick correctly notes that the “shadow” market hanging out there is huge. A few snippits:
Loans in the foreclosure process (either REOs or in-process) total 1.7 million homes, down from 1.9 million a year ago. Given that total home sales in America seem to be hovering around 5 million per year, this is a huge portion of the inventory.
Share this:
The Livingston Survey — Semi-Good News
Regular readers of this blog will note that I’m enamored with the Philadelphia FED’s surveys of professional economists. They actually do two surveys — one quarterly series, which has a slightly larger survey base, but doesn’t go into as much depth; and the semi-annual Livingston Survey, which has a smaller audience but a lot of detail. For direct access to the current Livingston Survey, click here.
Bottom line? The first half of 2011 isn’t as rosy as economists previously predicted, but they’re still modestly bullish on the second half of the year. Currently, the annualized GDP estimate is an anemic 2.2%, down from an almost-equally boring 2.5% in the December survey. However, GDP growth in the second half of the year is expected to be even stronger than previously thought, with second-half growth forecasted at an annual rate of 3.2%. More significantly, previous estimates of unemployment are being cut. In the last survey, economists collectively projected that year-end 2011 unemployment would stand at 9.2%; today, that projection has been lowered to 8.6%. Of course, these projections were surveyed before the most recent nasty jobs-growth reports, so everyone who uses this data is taking a bit of a “wait and see” prospective.
The nasty news is on the inflation front — prior estimates put the consumer price index rise from 2010 to 2011 at 1.6%; current consensus thinking is 3.1%. While that doesn’t sound like much, the producer price index is even worse — a prior estimate of 1.9% is now being revised to 6.3%. Both indices are expected to settle down in 2012, but we can only hope.
With that in mind, projections of T-Bill and T-Note rates are, not unexpectedly, higher than previously thought. The current 3-month T-Bill rate (as of this morning) is 0.04%. Current thinking is that we will end June in the range of 0.08%, but that by the end of 2012, 3-month bill rates will be up to 1.58%. Ten-year Note rates will follow a similar, but slightly flatter pattern (representing a slight expected flattening in the yield curve). The 10-year composit Note rate as of this morning (according to the Treasury Department) was 3.77%. Economists actually project it will decline a bit by month-end (to 3.25%), then rise slightly by the end of 2012 to 4.5%.