ACCRE Report, June, 2021
It was a very good month, but a hard one to figure out. ACCRE again outperformed the S&P on a monthly basis, but we’re still playing catch-up from the very uneven first quarter. That said, ACCRE’s total return was 7.93% for the month, and so a dollar invested at the inception (April, 2017) would now be worth $1.74. In comparison, the S&P 500 gained a not unrespectable 2.22%, and so if that same dollar had been invested in an S&P Index Fund bat the inception, it would be worth $1.82 today. Global real estate continues to lag, returning only 0.84% in June (again, not bad), and so that same dollar invested in the S&P Global Real Estate index would be worth $1.35 today, including both price and income returns.

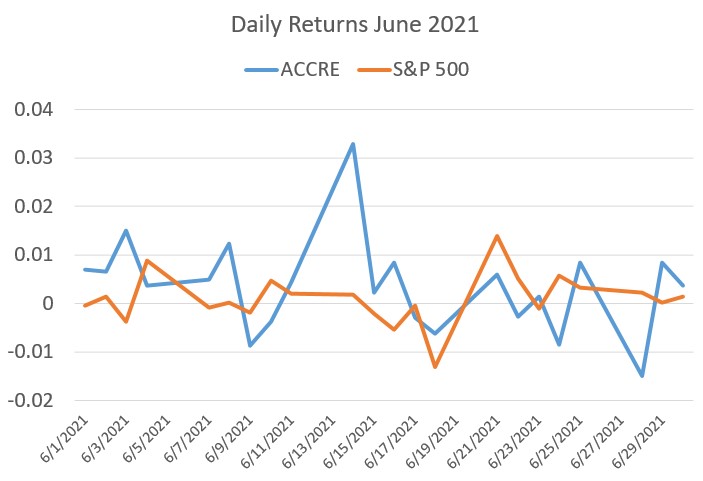
As you know, we also track the Sharpe Ratio and correlation statistics to see how ACCRE performed as a diversifier for a broader portfolio. Here’s where things get interesting — we shoot for a 50% positive overall correlation coupled with a lower standard deviation of returns, which should allow ACCRE and the broader market to generally point in the same direction but to attenuate sudden market shifts. For the life of the fund, we are right at the 50% mark, and ACCRE’s standard deviation of excess returns is indeed lower than the broader market. However, in June, the correlation went nearly to zero. Now, both return streams were overall positive, but in very different ways. Note that 30 days is a fairly short time to consider correlations of returns, but it does point to something we’ll want to keep an eye on — buried in these prices are market reactions to a host of complex sector fundamentals. We’ll explore this later in the month.
By the way, this month I’ve included a day-to-day graph of daily returns for ACCRE and the S&P just to visually demonstrate the lack of daily correlation.
| S&P 500 | |
| Average Daily Excess Returns | 0.0505% |
| Standard Deviation of Excess Returns | 1.2795% |
| Sharpe Ratio (Life of Fund) | 3.9456% |
| ACCRE Fund | |
| Average Daily Excess Returns | 0.0453% |
| Standard Deviation of Excess Returns | 1.1912% |
| Sharpe Ratio (Life of Fund) | 3.8060% |
| Correlation (Life of Fund) | 51.3918% |
| Monthly Correlation (June, 2021) | 1.9972% |
As always, if we can answer any questions about REITS or real estate in general, please reach out. We look forward to hearing from you.
John A. Kilpatrick, Ph.D., MAI — john@greenfieldadvisors.com


Leave a comment