Archive for July 2021
Repeat Sales Analysis
It’s always nice to be cited in someone else’s research paper! Case in point, a nicely done real estate paper written by three young scholars out of U. Aukland and U. Hong Kong just hit my desk, and much to my enjoyment, they cited my Journal of Housing Research piece on Repeat Sales Analysis. Intriguingly, my original work was on the use of this technique to identify the negative impact of environmental contamination on property prices. Conversely, their work was on the positive impact of water views on property prices. Indeed, this illustrates the fact that, at the far ends of the valuation spectrum, the same methodologies can prove useful.
After exploring repeat sales as a potential tool, the three authors ended up opting for a weighted least squares regression, noting (and I agree with them on this point) that repeat sales models have a “well known error distribution characteristic.” The simple fact is, parametric models, with which most real estate students are familiar, are usually not handy for dealing with real estate data, which is highly non-parametric. However, parametric models (such as regression analysis) require lots of data, and real estate analysis problems are often challenged with thin data sets. There are good non-parametric methodologies out there (such as repeat sales) for such limited data situations, but the statistical properties are not well characterized. However, they were able to incorporate repeat sales into their hedonic regression model. At Greenfield we’ve similarly used nonparametric methods to inform instrumental variables in a method that emulates 2-stage least squares.
As the demands for reliability of valuation models increase, finding ways to better characterize the reliability and confidence of appraisal methods deserves increasing attention. Academic research scholars are used to using large data sets and parametric methods with well-defined statistical characteristics. Practitioners — a category that includes both appraisers and investors — are usually faced with poor data sets and traditional, somewhat heuristic models which work well in practice but have little in the way of statistical characterization. Some academic organizations, such as the American Real Estate Society, strive to span the gulf between research and practice, but more remains to be accomplished in valuation modeling.
The paper, by the way, is “An Empirical Study of Sea View Value by Repeat Sales Method” authored by Edward Chung Yim Yiu (U. Aukland) and Chau Kwong Wing and Siu Kei Wong (U. Hong Kong). Their study was supported by the Research Group on Sustainable Cities and the CRCG Conference Grant for Teaching Staff of the University of Hong Kong, and their findings are available on the Social Sciences Research Network and on Researchgate.
John A. Kilpatrick, Ph.D., MAI — john@greenfieldadvisors.com
Share this:

More liquidity, fewer RE deals
There is a lot of attention on the owner-occupied housing front, with costs/prices skyrocketing and affordability tanking. However, COVID has had complex and somewhat unpredictable impacts on the commercial real estate (CRE) market.
First to set the stage, commercial lenders became much more conservative after the 2008/10 debacle, even though most of that was felt in the residential sector. Non-performing commercial real estate debt was a manageable 0.86% among the nation’s 325 largest banks at the end of 2020, albeit up from 0.41% at the end of 2019. By comparison, at the peak of the previous recession, this stood at 8.6%. Banks have largely focused on lower-leveraged loans and kept higher reserves. Indeed, the lack of distressed inventory has put distressed buyers in a position of having too much money chasing too few deals. Distressed buyers are hoping for discounts in the 30% range, but having to settle for 10% to 18% discounts.
Even in the non-distressed arena, there is a lot of capital (both debt and equity) in the market. Surprisingly, a lot of this is coming from debt funds, which leverage returns by getting an equity slug on top of the dent. As of early May, 2021, there were about 130 such debt funds in the market place chasing fewer and fewer deals. By the end of 2020, CRE sales had fallen by 32% from 2019, according to Real Capital Analytics. In the month of January, 2021, sales were down 58% year-over-year. Among the investments of choice, save sectors (multi-family, industrial, self storage) are getting even better terms than they were pre-COVID. However, lenders are asking more detailed questions now about minutia such as collections and tenant financials. Nonetheless, there is money to be had, even for distressed deals, and while banks are holding out for 60% – 70% LTVs on construction lending, some borrowers are getting as much as 90%. Some development companies are finding success raising equity for pipeline deals, rather than traditional property-by-property investments.
One of the more interesting twists has been the movement of foreign investors from major markets into smaller markets. In 2011, for example, 76.9% of foreign investment in the US was in Top-10 markets, according to a recent study from Marcus and Millichap. However, thus far in 2021, this has declined to 58.5%. More striking — in 2011, about a third of foreign investment went to one city, New York. Today, only about 10% of such investment is flowing into The Big Apple. Not surprisingly, that same study finds that retail and hotel investment has declined precipitously, while multi-family and industrial have taken up the slack. Interestingly enough, office investment has varied widely over the past five years, down somewhat from 2019.

Much of this information came from two great studies in the current edition of Real Estate Forum, one by Erika Morphy titled “An Abundance of Liquidity” and another by Erik Sherman titled “Distressed Real Estate Doubles But It’s Still Not Enough for a Buying Spree”.
Share this:

ACCRE Report, June, 2021
It was a very good month, but a hard one to figure out. ACCRE again outperformed the S&P on a monthly basis, but we’re still playing catch-up from the very uneven first quarter. That said, ACCRE’s total return was 7.93% for the month, and so a dollar invested at the inception (April, 2017) would now be worth $1.74. In comparison, the S&P 500 gained a not unrespectable 2.22%, and so if that same dollar had been invested in an S&P Index Fund bat the inception, it would be worth $1.82 today. Global real estate continues to lag, returning only 0.84% in June (again, not bad), and so that same dollar invested in the S&P Global Real Estate index would be worth $1.35 today, including both price and income returns.

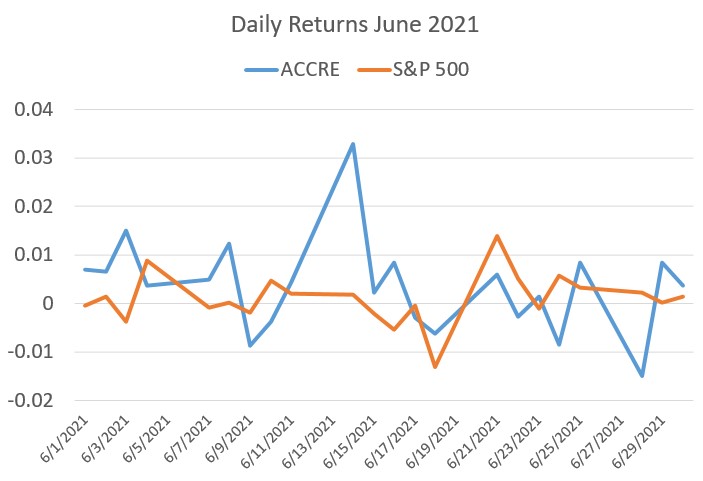
As you know, we also track the Sharpe Ratio and correlation statistics to see how ACCRE performed as a diversifier for a broader portfolio. Here’s where things get interesting — we shoot for a 50% positive overall correlation coupled with a lower standard deviation of returns, which should allow ACCRE and the broader market to generally point in the same direction but to attenuate sudden market shifts. For the life of the fund, we are right at the 50% mark, and ACCRE’s standard deviation of excess returns is indeed lower than the broader market. However, in June, the correlation went nearly to zero. Now, both return streams were overall positive, but in very different ways. Note that 30 days is a fairly short time to consider correlations of returns, but it does point to something we’ll want to keep an eye on — buried in these prices are market reactions to a host of complex sector fundamentals. We’ll explore this later in the month.
By the way, this month I’ve included a day-to-day graph of daily returns for ACCRE and the S&P just to visually demonstrate the lack of daily correlation.
| S&P 500 | |
| Average Daily Excess Returns | 0.0505% |
| Standard Deviation of Excess Returns | 1.2795% |
| Sharpe Ratio (Life of Fund) | 3.9456% |
| ACCRE Fund | |
| Average Daily Excess Returns | 0.0453% |
| Standard Deviation of Excess Returns | 1.1912% |
| Sharpe Ratio (Life of Fund) | 3.8060% |
| Correlation (Life of Fund) | 51.3918% |
| Monthly Correlation (June, 2021) | 1.9972% |
As always, if we can answer any questions about REITS or real estate in general, please reach out. We look forward to hearing from you.
John A. Kilpatrick, Ph.D., MAI — john@greenfieldadvisors.com


