ACCRE Report, October, 2021
It’s been a busy month, both for the stock market and here at Greenfield!
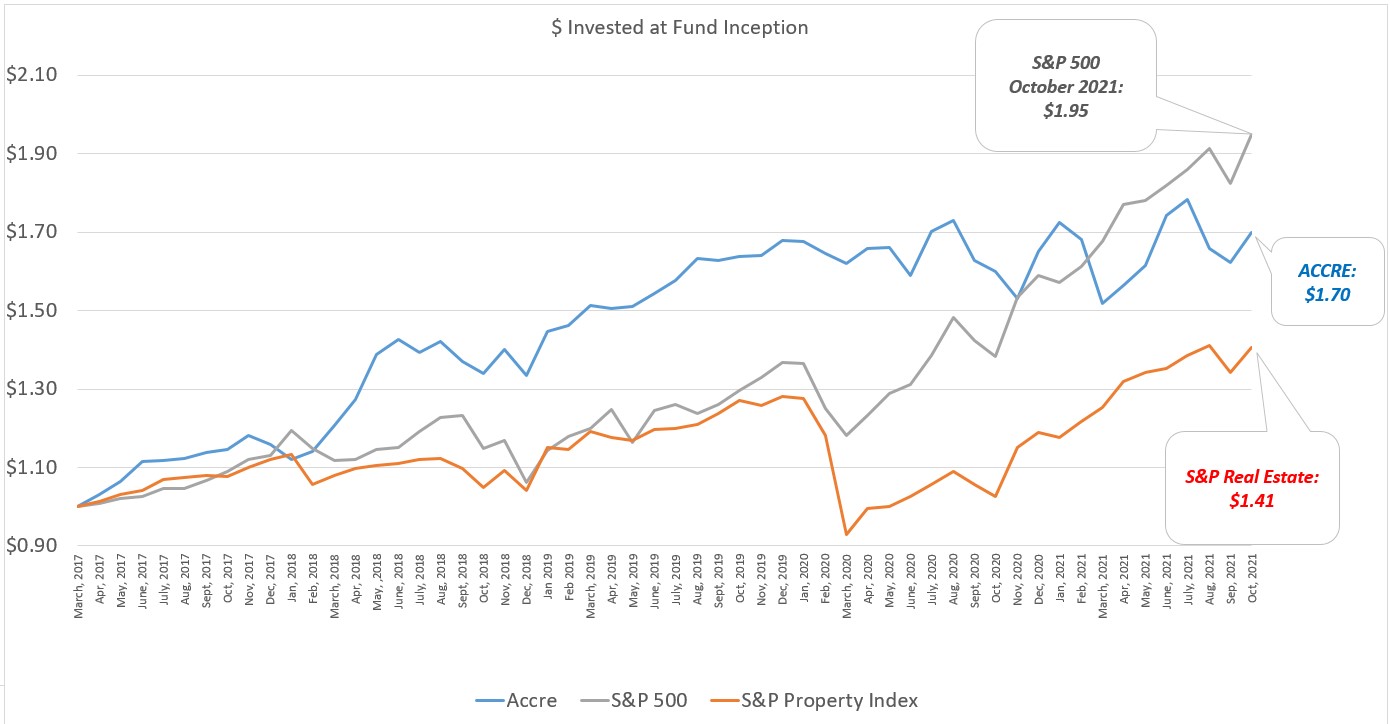
First the S&P 500 — our primary benchmark — scored one of it’s best months all year, up 6.91% by our metrics. Note that puts the broad market up 22.6% on the year. ACCRE was no slacker this month, up 4.75%, besting the S&P Real Estate index which was up 3.93%.
These are of course reflective of monthly returns. When we dig in a bit to daily returns, a somewhat different picture emerges, as shown in the Sharpe Ratio metrics, below:
| S&P 500: | ||
| Average Daily Excess Returns: | 0.0529% | |
| Standard Deviation: | 1.2463% | |
| Sharpe Ratio (life of the fund) | 4.2449% | |
| ACCRE: | ||
| Average Daily Excess Returns: | 0.0402% | |
| Standard Deviation: | 1.1769% | |
| Sharpe Ratio (life of the fund) | 3.4160% | |
| Correlation of Daily Returns (life of the fund) | 49.8497% | |
| Correlation of Daily Returns (month of October) | -19.3963% |
Well, THAT was interesting! ACCRE and the S&P 500 are generally positively correlated, both overall and on a month-to-month basis. We want ACCRE to serve a diversifying role within a larger overall portfolio, and correlations in the 50% range, while not a target, are certainly viewed positively. Further, one month does not a market make, but given the long bull run in both the broader market and real estate, is a one-month negative correlation telling us something? Particularly in light of the fact that both indices ended up the month on a positive note?
I can’t help but note that ACCRE and its two benchmarks have all continued on a positive trend thus far in November. We’ll watch this closely, and keep you updated.
Best wishes for a great upcoming Thanksgiving Holiday! As always, if you have any questions about REITs or real estate in general, please don’t hesitate to reach out!
John A. Kilpatrick, Ph.D., MAI — john@greenfieldadvisors.com


Leave a comment