Archive for November 2021
Economics — Following the Bouncing Ball
We hope all of you had a great Thanksgiving, and any indigestion you felt Friday was from too much turkey rather than too much stock market.
The broader stock market indices had a terrible day Friday — the S&P 500 was down about 2%, although as of this writing it has re-gained about half of its loss. Our in-house REIT fund, ACCRE, was developed in no small part to attenuate such falls. We lost only 0.9% on Friday, and we’ve re-gained all of that and then some today.
More to the point, though, what’s happening? Consumers (and yes, the stock market, too) hears about “the Omicron variant” and “inflation” and not surprisingly reacts defensively to unsettling news. We’re no experts on the Covid virus (although we listen carefully to the folks who are legit experts!) but perhaps we can sort out some of the noise with the aid of some charts from CNN Business and some others.
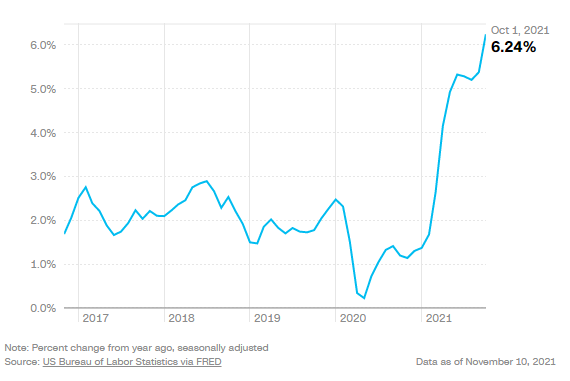
First, let’s look at inflation. If you’re under, say, 55, for your entire adult life inflation has hovered around a very manageable 2% to 3%. In the 1970’s and early 80’s, of course, inflation was a big deal and double-digit annual price increases weren’t unusual. In the past few years, both pre- and post-COVID, inflation has actually been on a downward trend, getting very close to zero in early 2020. However, the flood of stimulus money in the economy, and the rebound after over a year of semi-lock-down, has triggered prices. On an annualized basis, prices in October were about 6.24% above a year earlier.
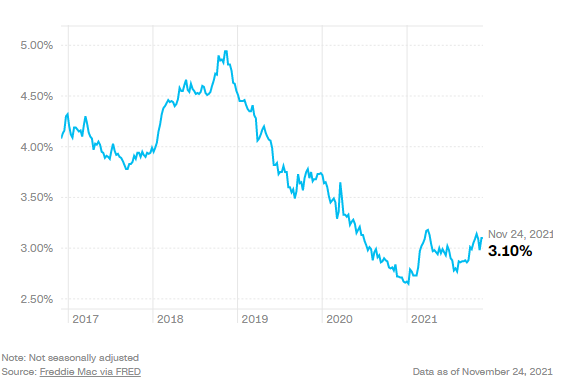
So, how big of a danger is this? In other words, is this inflation both real and permanent? A peek at the interest rate market may be insightful. Both the US Treasury long-bonds and the 30-year mortgage market have barely reacted. Both are up from their COVID-recession doldrums, but neither seem to have reacted to consumer prices.
10-year Treasuries and 30-Year Fixed Rate Mortgages

So, bottom line, is the economy healthy? In most respects, yes. As of October 1, the economy was adding about 148,000 jobs per month, which is near the high end of the “healthy” range (100,000 to 150,000). The unemployment rate stood at 4.6%, not quite at the pre-pandemic lows, but about where it was five years ago. Real gross domestic product stood at $19.5 Trillion (annualized) as of the end of the 3rd quarter, which is a new record high and nearly back on the pre-pandemic trend line. Consumer spending — which is driving the inflation fears — is also at a record high of $13.9 Trillion and has been back on its pre-pandemic trend line for most of 2021. All of these are healthy signs of a stable but growing economy.
That said, there are a few clouds on the horizon to be watched carefully. The S&P Case-Shiller home price index sets a new record high each month, but annualized housing starts are actually somewhat lower (1.6 million) than the peak of about 1.7 million set earlier this year. However, housing starts are still well above the 1.2 million level we saw for most of the past four years. It remains to be seen if accelerated housing starts will ameliorate housing prices. Retail inventories as a percentage of sales are lower than we’ve seen any time in the past five years, standing at about 126% (the pre-pandemic average was about 140%). This suggests more consumers chasing fewer goods with commensurate price pressure.
The stock market is a pretty good gauge of economic expectations. Looking at the trends for the past five years, the hic-cup on Friday appears to be nothing more than post-Thanksgiving indigestion. We hope that is the case.

As always, we enjoy hearing from you folks. If you have any questions about economic topics, particularly with a bent toward real estate, please let us know!
John A. Kilpatrick, Ph.D., MAI — john@greenfieldadvisors.com
Share this:

Economies of Scale in Real Estate
In MBA school, students learn about economies of scale. The concept is pretty simple — the more of something you do, the more you can flatting out overhead. Let’s put this in the most basic terms. Joe owns a small plumbing company. He has to buy a truck and tools and a supply of plumbing gadgets. If he only services one customer a day, he may barely break even. However, if he can service 10 customers per day, he might be able to hire a cheap apprentice and make a lot of money. Economies of scale. Get it?
Mostly, students are shown graphs that look like this:

The implication is pretty straightforward — if we can just build a bigger and bigger algorithm, we can own the universe. Indeed, some real estate companies have certainly tested the boundaries of this idea. Until the mid-1990’s, most REITs were fairly small, compared to today. Sometime around 1996, there was a systemic shift upward in the size of REIT IPOs, and today, REITs are orders of magnitude larger than they used to be.
Nonetheless, in some corners of the real estate field, smaller still seems to be better. Brokerage, for example, benefits a bit from some aggregation, but is still very much a local hand-shake sort of business. Less-than-investment-grade investing (“B” and “C” properties) is still a localized business. Brownfield redevelopment and other niches are have proven difficult to aggregate. Indeed, in some niches of nearly every field of endeavor, the economies of scale equation looks more like this:
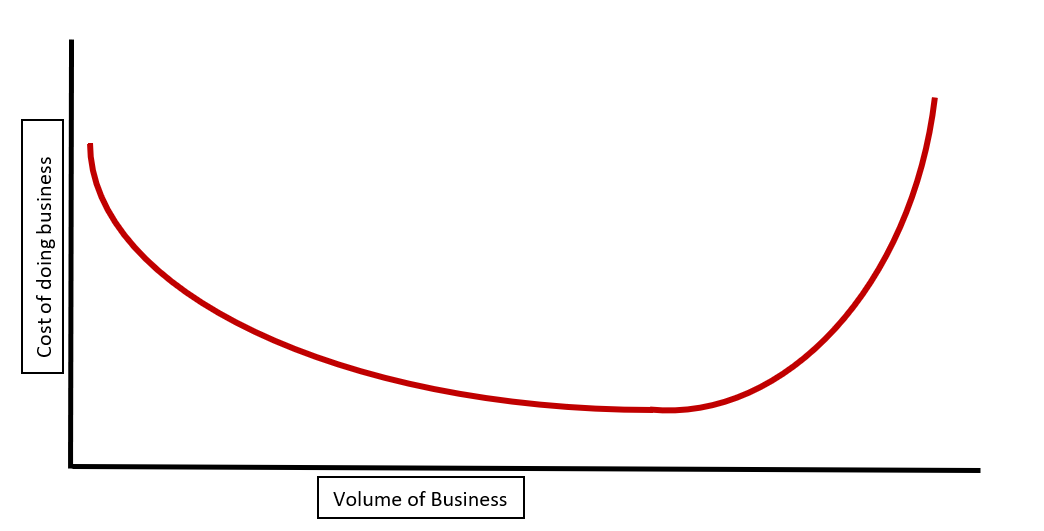
Beyond a certain point of inflection, the cost of doing business actually rises. Span of control is a difficult problem, particularly in complex fields. The more something can be commoditized, the further out that point of inflection is. However, there are limits to commoditization.
I was brought to think about this by the recent embarrassment of Zillow and their iBuying experiment. It was a very simple idea, really — local “flippers” were making tons of money buying dog properties in good locations, spending a few bucks on cosmetics, and selling into the rising price market. Indeed, my pet Pomeranian could have made money in residential real estate in the past 2 years. However, when markets start to flatten, some localized talent is needed. “You gotta know when to hold ’em, know when to fold ’em” as the old song goes. When markets shift, the economies of scale inflection point scales with it.
For those of you who weren’t keeping up with the Zillow news, the company set up a buying service a few years ago and started simply cutting a check on properties that their algorithm indicated could be flipped for a profit. I would argue that in normal markets, this is the sort of business that requires extensive localized knowledge. In rapidly changing markets, even more so. This isn’t a critique of mass appraisal models. Indeed, I’m a big fan of those, and they prove useful in many situations. However, the act of taking an individual property thru the “flip” process is complex and fraught with risks. A mass appraisal model can inform the participant, but can’t be a substitute for entrepreneurial effort.
Reportedly, Zillow had quite a few billions of dollars on the table, so this isn’t a small undertaking. Zillow is laying off about 1000 people — around 25% of their entire workforce. The investments were in about 25 or so secondary sunbelt cities, like Phoenix and Las Vegas. They’re said to be dumping about 18,000 residences, expecting to take a 5% to 7% loss on the transactions.
About 5.64 million homes sold in America in 2020, so 18,000 isn’t a real macro market mover. Of course, this is a pain for the 1,000 Zillow employees who are losing their jobs, and Zillow stock is down about 40% from the peak in late October. Conversely, the housing market is still pretty good and Zillow’s exit may create niches for local entrepreneurs. We’ll keep you posted.
As always, if you have any questions on these issues, please don’t hesitate to reach out. We look forward to hearing from you!
John A. Kilpatrick, Ph.D., MAI — John@greenfieldadvisors.com
Share this:

ACCRE Report, October, 2021
It’s been a busy month, both for the stock market and here at Greenfield!
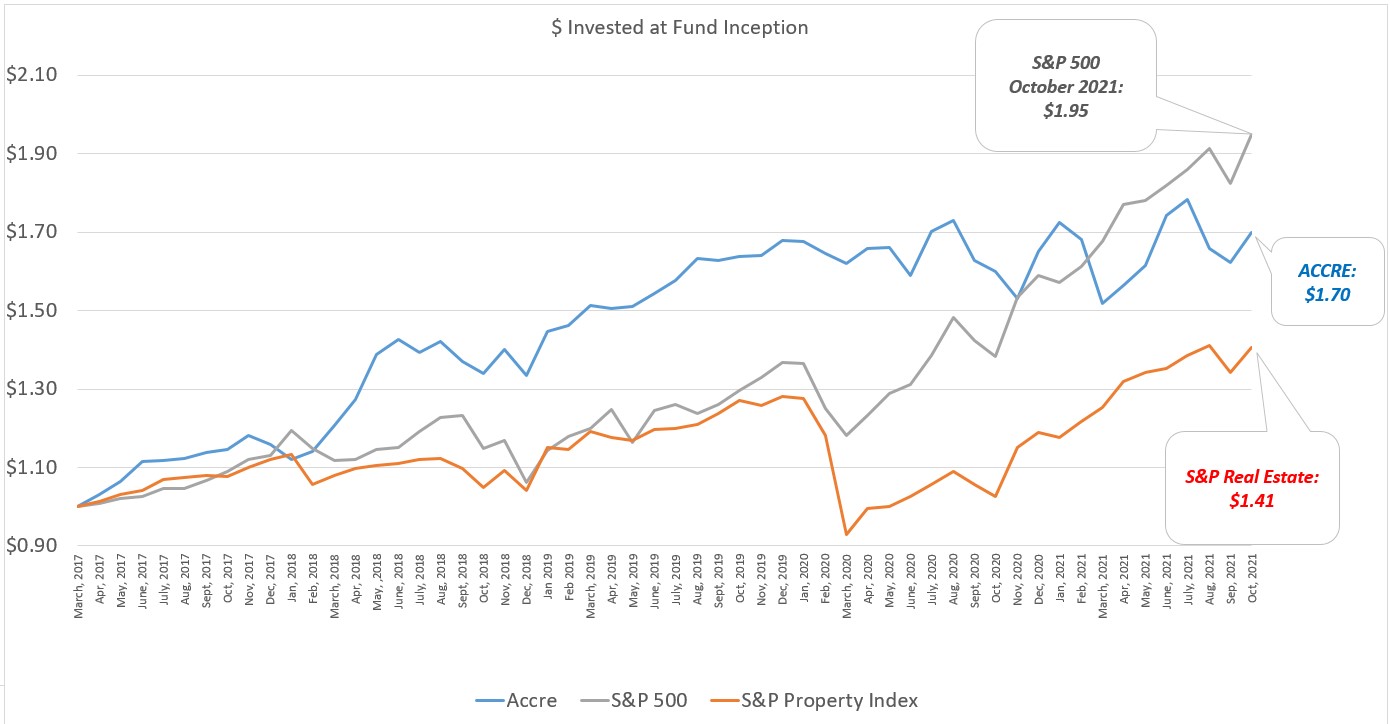
First the S&P 500 — our primary benchmark — scored one of it’s best months all year, up 6.91% by our metrics. Note that puts the broad market up 22.6% on the year. ACCRE was no slacker this month, up 4.75%, besting the S&P Real Estate index which was up 3.93%.
These are of course reflective of monthly returns. When we dig in a bit to daily returns, a somewhat different picture emerges, as shown in the Sharpe Ratio metrics, below:
| S&P 500: | ||
| Average Daily Excess Returns: | 0.0529% | |
| Standard Deviation: | 1.2463% | |
| Sharpe Ratio (life of the fund) | 4.2449% | |
| ACCRE: | ||
| Average Daily Excess Returns: | 0.0402% | |
| Standard Deviation: | 1.1769% | |
| Sharpe Ratio (life of the fund) | 3.4160% | |
| Correlation of Daily Returns (life of the fund) | 49.8497% | |
| Correlation of Daily Returns (month of October) | -19.3963% |
Well, THAT was interesting! ACCRE and the S&P 500 are generally positively correlated, both overall and on a month-to-month basis. We want ACCRE to serve a diversifying role within a larger overall portfolio, and correlations in the 50% range, while not a target, are certainly viewed positively. Further, one month does not a market make, but given the long bull run in both the broader market and real estate, is a one-month negative correlation telling us something? Particularly in light of the fact that both indices ended up the month on a positive note?
I can’t help but note that ACCRE and its two benchmarks have all continued on a positive trend thus far in November. We’ll watch this closely, and keep you updated.
Best wishes for a great upcoming Thanksgiving Holiday! As always, if you have any questions about REITs or real estate in general, please don’t hesitate to reach out!
John A. Kilpatrick, Ph.D., MAI — john@greenfieldadvisors.com


