ACCRE Report, July, 2021
July was a “boringly good” month. I say that because ACCRE and other portfolio components all performed extremely well. ACCRE slightly outperformed the S&P (2.68% versus 2.27%) but neither of these can be sneezed at. The S&P Global Property Index had total returns of 2.36%, also a solid performance. I would note that the S&P broad market index has had 6 straight months of positive returns, and 17 positive months out of the past 24. As such, ACCRE is competing in rarefied territory.
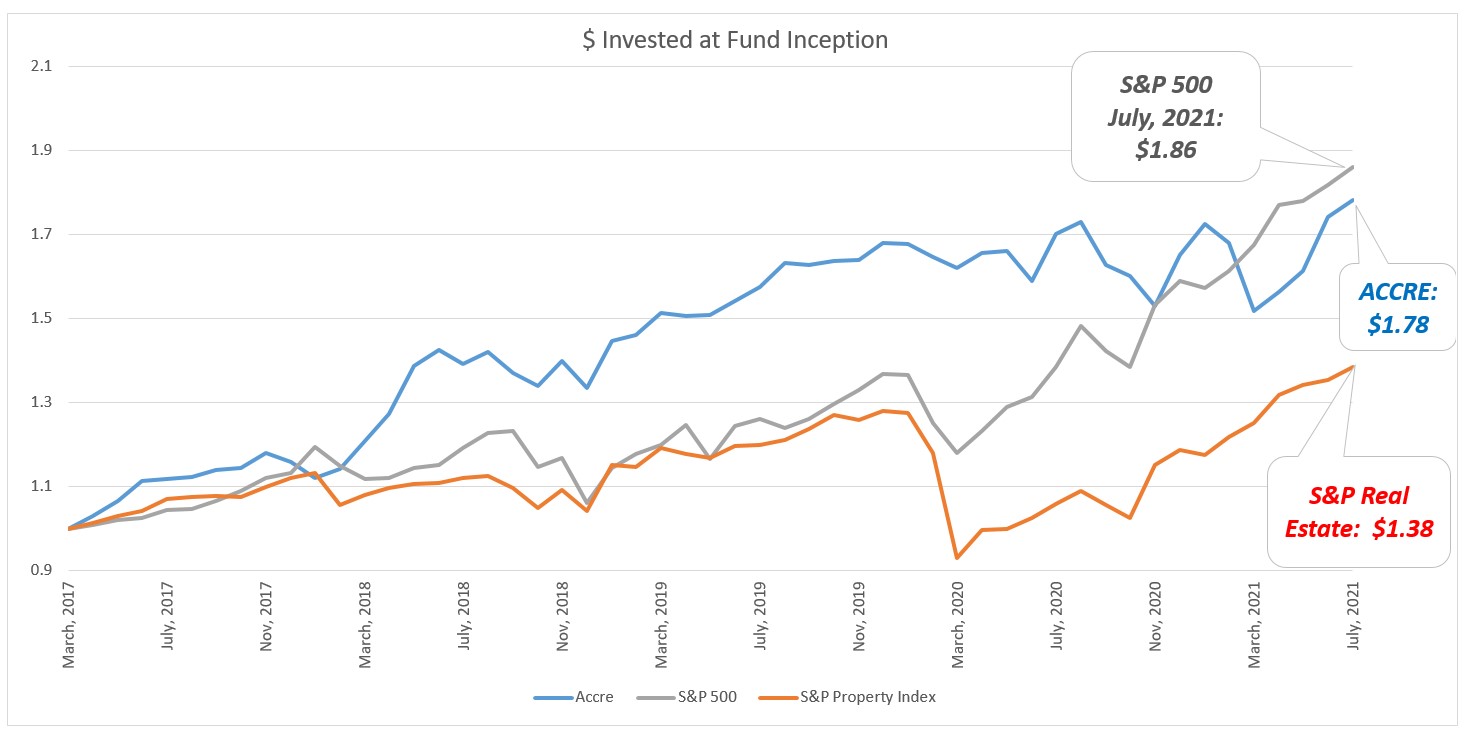
Thus, a dollar invested in ACCRE at the inception (April 1, 2017) would be worth $1.78 today, for an average annual return of 14.36%.
| S&P 500 | |
| Average Daily Excess Returns | 0.0516% |
| Standard Deviation of Excess Returns | 1.2712% |
| Sharpe Ratio (Life of Fund) | 4.0604% |
| ACCRE Fund | |
| Average Daily Excess Returns | 0.0470% |
| Standard Deviation of Excess Returns | 1.1894% |
| Sharpe Ratio (Life of Fund) | 3.9508% |
| Correlation (Life of Fund) | 50.9401% |
| Monthly Correlation (July, 2021) | 12.0631% |
ACCRE continues a healthy overall correlation (life of the fund) with the S&P, but also continues a two-month run of surprisingly low monthly correlations. We suspect this has a bit to do with the volatility of both indices, but we’ll continue to monitor.
As always, if we can answer any questions about REITS or real estate in general, please reach out. We look forward to hearing from you.
John A. Kilpatrick, Ph.D., MAI — john@greenfieldadvisors.com


Leave a comment