ACCRE Mid-Month Report, September, 2020
The mid-month report always deals with diversification and the Sharpe Ratio (the risk-adjusted abnormal returns). Every month, month after month, we exceed the S&P and show solid diversification. August was no exception.
However, we talk about diversification as a given, without ever really justifying why it’s a good thing. Indeed, when we teach investments in college (and I just finished team-teaching investments at WSU in the Spring Semester), we accept that everyone buys into diversification as a predicate to discussing the topic.
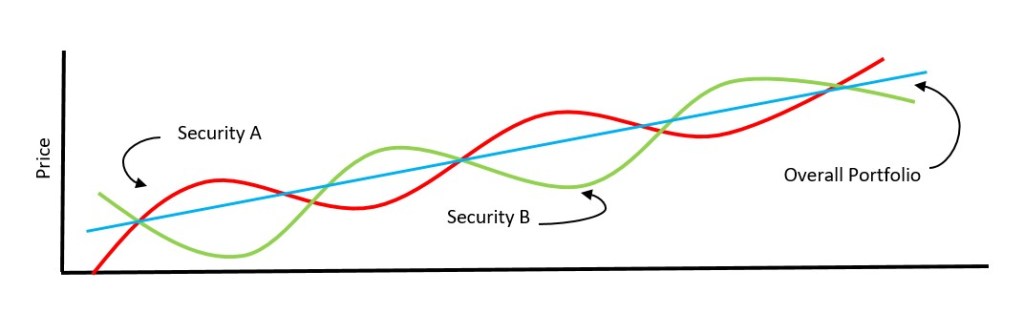
A diversified portfolio allocates investments in a way that reduces exposure to the volatility of any one asset. However, by itself, that’s not enough. The goal is to have a portfolio with less variance than the weighted average of all of the variances of the constituents, and in fact a well-diversified portfolio should have less overall variance than even the lowest individual security in the portfolio. In the figure following, assume you own just one asset, “Security A”. Its general trend over time is upward, but at any given point in time it may actually have declined in value, by cycling around the trend line. Now you add “Security B” to the portfolio. It is nearly perfectly counter-cyclical to A, and so the overall price trend is still solidly upward but with almost no volatility.
Of course, in a perfect world, such absolute diversifications doesn’t exist. However, as we’ve shown, ACCRE does a great job at attenuating a typical securities fund (i.e. — an index of the S&P 500), without giving up liquidity.
Now, on to ACCRE. It was another solid month for both ACCRE and the S&P, as demonstrated below:
| S&P 500: | |
| Average Daily Excess Return | 0.0379% |
| Standard Deviation | 1.3401% |
| Sharpe Ratio | 2.8271% |
| ACCRE Fund: | |
| Average Daily Excess Return | 0.0532% |
| Standard Deviation | 1.1379% |
| Sharpe Ratio | 4.6796% |
| Correlation (overall) | 55.8098% |
| Correlation (monthly) | 51.6244% |
Note that ACCRE has a better Sharpe ratio on two counts. First, the absolute value of the average daily returns is higher. Second, ACCRE has a substantially lower level of volatility, measured by the standard deviation over time. Finally, while pointed in the same direction as the S&P (positive correlation), the correlation is well less than 100%, showing a high degree of attenuation in the portfolio.
Well, that’s about it for this month. Stay safe, and we hope to see you all again soon.
John A. Kilpatrick, Ph.D., john@greenfieldadvisors.com


Leave a comment