Archive for March 28th, 2022
Dysfunction in the housing market
Yes, inflation’s bad. I just bought two racks of ribs at my local grocery store. For that price, Chef Gordon Ramsey should bring them over to my house.
But I digress. This is about real estate, and Axios this morning had an excellent article by Neil Irwin with the opening line, “The U.S. housing market this spring selling season is looking like a multi-car collision…” Irwin’s focus is on mortgage rates, which “…have spiked more rapidly than they have in decades…” He’s right, but that only tells half of the story.
Let’s start with house prices, which are utterly on a tear. Since the troughs of the 2008-2011 period, house prices have rebounded amazingly. Indeed, annual price increases in the 2013 period were at nearly the same level as they were during the peak of the “bubble” (remember the bubble?). Fortunately, annual price increases settled out for most of the last decade, at the somewhat normal level of about 2% to 3% above CPI inflation. Then COVID came, and suddenly home ownership was a way to achieve social distancing, home schooling, working from home, and smart investing all at the same time. Seemingly, the urge to own a home hasn’t been so viscerally felt since the period immediately after WW-II. Supply simply couldn’t keep up with demand, and construction materials and labor prices went thru the roof as well, putting amazing price pressure on homes. If you had a $100,000 house in an average city in America in January, 1991, it was worth $382,700 at the end of 2021. Of course, that’s an a average. If that house was in Austin, Texas, it went up to $640,230. In Boise, ID, the price today would be $578,260. In Salt Lake City, it’s $625,720. These are high demand cities, folks, and people want to move there and pay whatever price it takes.

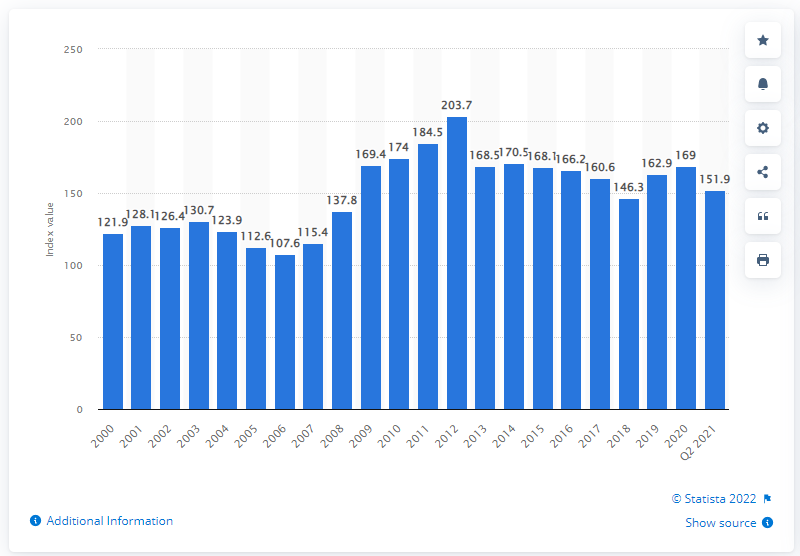
Now, add to that Irwin’s article, which is all about mortgage rates. Three weeks ago, a 30-year, fixed rate mortage was 3.76%. Today, it’s 4.42%. That means that a family which could afford a $2,000 per month house payment could have borrowed $424,000. Today, they can only borrow $375,000. Yet, prices continue to rise. We measure this with something called the Housing Affordability Index. If the HAI equals 100, then the median household in America has exactly enough income to buy the median house. Thanks to record low interest rates the past few years, the affordability index has been in positive territory (that is, above 100) since 2000, and indeed this positive affordability has fueled the run-up in house prices. However, that crashing sound you just heard was the index dropping remarkably from 169 to 151.9, the biggest year-over-year drop since the peak of the 2010-2012 recession (marked by the disappearance of extraordinarily favorable lending). While the raw numbers aren’t that bad, the trend direction, particularly coupled with all the other economic issues, does not bode well for the health of the housing market.
As always, if any of you would like to chat about this or have any comments, please reach out. I look forward to hearing from you!
John A. Kilpatrick, Ph.D., MAI — john@greenfieldadvisors.com


