Posts Tagged ‘politics’
The ROAD to Housing Act
This week, the U.S. Senate passed a sweeping bi-partisan package of bills aimed at lowering housing costs. The measure faces some opposition in the House due to some political pressures, but it’s likely this will eventually land in the White House for a signature. Given the widespread concern in the electorate about housing affordability, these politicos can hardly be seen as going home doing nothing. However, will this package do what it intends?
One section of the bill aims to ‘cut red tape around environmental reviews, empowering state, local, and tribal governments to streamline reviews and increase housing development.” (A summary of the bill from the Senate Committee on Banking, Housing, and Urban Affairs.) This has long been a sore spot for housing developers, but these sorts of review usually happen well before the first shovel of dirt is turned in a new subdivision. Further, this will require local, state, and tribal rule making, and I think you can already see the long knives being sharpened by attorneys representing environmental interests. This part of the bill will be tied up in 10,000 court cases for quite a few years, and even if it is ultimately successful, it may reduce new housing costs by one or two percentage points ten or so years from now. None the less, it’s something.
There is a related provision to offer grants or loans to state, local, and tribal governments to assist in updating local rules and regulations. Local urban planning departments are strained already, and the notion of trying to re-write local environmental and housing rules on the fly without some assistance is unimaginable. That said, what we’re talking about is money to hire new staff and consultants, and so again this is something that will only kick in down the road.
The bill encourages increased production of manufactured housing. Currently, a manufactured home is required to have a steel chassis so that it can be moved from one place to another, like a trailer. However, these homes are almost never moved. The new rules would update the definitions to include modules manufactured without a permanent steel chassis. Of course, this means a manufacturing infrastructure will have to be spun up, and local rules and regulations re-written to accommodate the new housing product. However, of the various provisions in the bill, this one perhaps holds the most utility for near-term help in the market.
Another section creates a program to offer grants and forgivable loans to homeowners and landlords seeking to repair homes. This provision also has some potential, although it probably aids small landlords much better than fixer-upper homeowners. I don’t see it doing anything for housing affordability, though, but I am open to argument. Nonetheless, anytime the Federal Government ‘creates a program’ without funding it, we can only wait and see. More benefit might come from a requirement that the Federal Housing Administration (FHA) increase the limits on loans for multifamily mortgages. This can have some substantial benefits for investors, increasing the availability of rental housing, but not necessarily for home ownership affordability.
Finally — and this is the provision that is giving the bill some headaches in the House — the bill would ban large institutional investors from directly or indirectly owning 350 or more single family units (with the exception of government entities). This is less of a deal than it’s made out to be. I’ll write a separate blog post sometime soon about this, but for the record, Blackstone owns 63,000 single family dwellings, which is roughly six-one-hundredths of one percent of the U.S. housing stock. My argument is that these large investors tend to overpay but this doesn’t crowd out actual home owners, it crowds out traditional mom-and-pop landlords. Again, that’s a matter for another discussion.
Since the House of Representatives doesn’t have a filibuster, and this has wide bi-partisan support (this being an election year), there’s a strong likelihood this will become law before summer. However, any actual impact of this is quite a few years down the road.
As always, if you have any questions or comments, please e-mail me!
John A. Kilpatrick, Ph.D., MAI
Share this:

A bit about tariffs.
We know, as a matter of empirical evidence, that chaotic tariff wars are horrendous for the economy. The research on that sailed a long time ago. So why do some countries still use them?
First, it’s helpful to understand an economic truism of the Law of Comparative Advantage. We teach a simplified version of this to undergraduates (at least the ones who pay attention) and Nobel Prizes have been won in its wake. Indeed, if you ever saw the movie “A Beautiful Mind” about the life of the great John Nash, you may be interested to know that while his Nobel was about game theory, it in fact was based on his observations about world trade.
It goes a bit like this. Let’s say there are two countries (in the classic example, we use Britain and Belgium). Let’s say Britain is wealthier than Belgium (which at the time, it was) and let’s also say that these two countries both make two things — Wine and Wool, in the classical example. Now Britain, being the wealthier and more advanced nation, is better and more efficient at both products than Belgium. This would suggest that Britain should make both products and simply ignore any trade with Belgium. Britain could do that by establishing huge trade barriers — tariffs — against Belgium, much like the U.S. is doing today against, well, everyone.
However, and here’s the rub — internally, Britain is better at wine than at wool. Make no mistake, it’s better at both than Belgium, but it make wine more efficiently and more cost effectively than it does wool. Belgium, on the other hand, is better at wool than at wine. Again, it’s less efficient than Britain at both, but internally, it’s better at wool than at wine.
The Law of Comparative Advantage has proven, time and time again, that Britain would be better off making nothing but wine, and Belgium at making nothing but wool, and the two countries trading freely with one another. Tariffs, in such cases, are not only bad for the poorer country (Belgium) but also for the richer one (Britain)!
Late last year, the conservative journal The Economist proclaimed that the U.S. economy was the ‘envy of the world.’ We had amazingly low unemployment, our inflation was coming down, our GDP had been growing constantly since the pandemic, and our stock market was on a tear. Yes, we had some internal inefficiencies, but these tended to be granular and needed to be addressed with a surgeon’s scalpel, not a sledgehammer. Yes, middle class incomes had not kept up with the cost of living over the past half century, but this was a matter of income inequality and not trade imbalance, and needed to be dealt with accordingly.
Over the years, America has made LOTS of things that other countries wanted. We export vast quantities of oil and natural gas. We export significant quantities of computers, vehicles, electrical machinery and equipment, aircraft, optical and medical apparatus, and pharmaceuticals. Vast swaths of America are devoted to growing exported agricultural products, such as soy beans and corn.
Further, and this may come as a shock to some, but one of the things other countries wanted was our dollar. They hoarded it. The rest of the world used it as a default currency, the one stable currency (along with, arguably, the Euro) which could be considered strong during chaotic times. It served the purpose that gold had served a hundred years ago. And yes, we produced it by the boat load (metaphorically speaking), and foreign countries had an insatiable appetite for it.
Poor nations use tariffs in order to protect and stabilize emerging businesses. In the previous example, if Belgium wanted to build up its own domestic wine industry, it would enact a tariff on imported British wine. In the short run, and in small doses, this may work. However, in the long run, it reduces British exports to Belgium, and thus the quantity of Belgian money they have to spend on Belgian wool. (The ‘what goes around comes around’ model of the economy.) Canada has an interesting tariff on imported milk products, which was agreed to during the current president’s prior administration. Indeed, he signed off on it as part of the replacement for NAFTA. Canada admits American milk products, but only up to a certain limit, and then above that taxes American milk heavily. Make no mistake, though, this Canadian tariff is a tax on Canadian consumers. Indeed, some emerging or mid-level economic countries prefer a mix of tariffs (which are like a sales tax on their own consumers) and income taxes to finance their governments. However, tariffs, being a sales tax, are highly regressive and depress the well-being of the middle class.
Rich nations, like the U.S., prefer to use income taxes (since there is so much income to tax, and it’s more efficient and less regressive) and let the middle class prosper without burdensome tariffs. Indeed, free trade benefits rich nations, like ours, more than it benefits poor nations. Nonetheless, the Law of Comparative Advantage tells us that both rich nations and poor ones are better off without burdensome and chaotic tariffs.
But, as the country song said, “not no mo’…” It takes a long time to craft a stable relationship with our trade allies. Like dropping a valuable vase on the floor, it only takes a moment to shatter it.
John A. Kilpatrick, Ph.D.
Share this:
RAND Study on the Housing Crisis
The RAND Institute, headquartered in Santa Monica, is (in my humble opinion) one of the top-tier sources for research on public policy issues. Founded in 1948 as a partnership between Douglas Aircraft and the Air Force, its founding members included Curtis LeMay and Hap Arnold. The affiliated Pardee Rand graduate school offers a well-regarded Ph.D. in public policy.
Two of the faculty members, economist Jason Ward and Sarah Hunter, a behavioral scientist, recently shared some of their research on the subject. First, they note that interest rates alone have driven up the monthly payment on typical home by as much as 40% over the past 3 years. I would note that this doesn’t factor in the increased cost of the home itself, increasing property taxes and insurance, and increasing costs such as utilities. The Harris campaign has proposed a $25,000 tax credit for first time buyers to assist with down payments. However, a similar pilot-project in California did not fare well and has been linked to driving up the cost of housing in some areas.
Conversely, rent costs have actually moderated a bit very recently, but only because rent growth was so high during and immediately after the pandemic. That said, the RAND researchers noted that a record number of renters are experiencing housing cost burden, that is, a total housing cost above 30% of gross income. Government incentives for renters are a mixed bag. The Low-Income Housing Tax Credit program provides about $13.5 Billion per year for developers of income restricted, subsidized housing. This program produces about 100,000 housing units per year. However, land use and zoning regulations — a local function — have actually been counterproductive in recent years, with restrictions on multi-family locations, density, energy efficiency, and parking requirements all driving up the cost of solving the housing problem. In much of California, for example, local regulations have driven up the cost of producing an efficiency apartment to nearly $1 million.
The current administration has provided $3.16 Billion to address homelessness, providing funding for over 7,000 local projects to provide housing assistance or support services. Some local governments are also stepping up to the plate. For example, Los Angeles passed a one-quarter cent sales tax in 2017 to fund about $355 million per year for homeless prevention services. This year, they have another measure on the ballot which would provide a $1.2 Billion bond measure to build supportive housing. Houston, Texas, is held up as a model for addressing homelessness with a housing-first approach. As a result, the Houston region has reduced homelessness by 63% over the past 10 years, with an emphasis on coordination across agencies.
Their research continues, and I’m reaching out to Professors Ward and Hunter in the coming weeks as I prepare for a talk I’m giving on this subject in late December. I’ll continue reviewing some of the issues and current research on the complex housing crisis we face in America, with an eye toward finding some consensus on steps forward to solve these issues and share my findings with you as I go along. As always, if you have any comments or questions on this or any other real estate related topic, please don’t hesitate to reach out.
John A. Kilpatrick, Ph.D., MAI
Share this:
Political picture of America
I tend to avoid political commentary on this blog, save for issues concerning the economy. However, this morning I stumbled on some data — or more specifically, data presentation — which will be of interest whether you are a republican, democrat, or something else entirely.
Robert Allison, writing on the SAS Learning Post this morning, has a great piece titled, “Building a Better Election Map“. Allison notes that we are all confronted with a congressional election map that looks something like this:
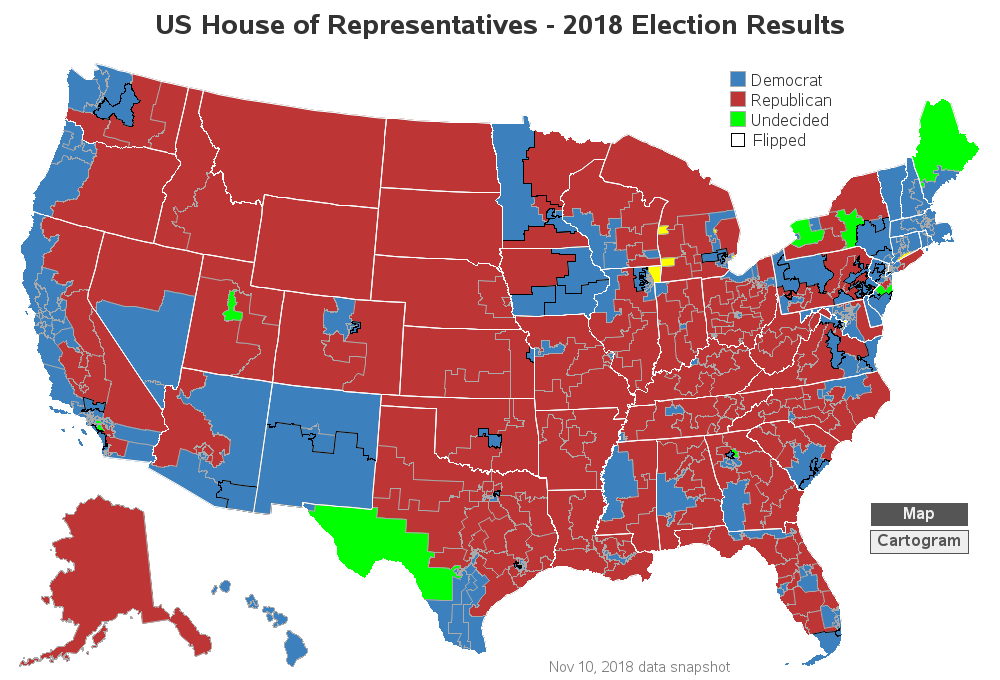
This is misleading on a lot of levels. From a republican perspective, it implies that they still have control of the vast expanse of America. For democrats, this map makes them question whether or not they really took control of the House of Representatives. It’s simply not a good way to combine the population distribution of the U.S. with the data on House representation, which is supposed to be apportioned according to that population distribution. Allison experimented with a number of formats, and ended up with a great interactive map that divides the U.S. up into 435 equal sized representational images and then color codes them according to the current representation. Note that this map also shows where “flipped” seats happened this year.

Well, ain’t THAT neat! This immediately lets the reader see where geographic trends are happening. Several interesting pieces of data come out instantly. For one, Texas is “bluer” than one might think. Second, the largest number of republican-to-democrat flips happened in pivotal Pennsylvania (not in California, where one might have thought listening to the newscasts). Third, the old Confederacy is a lot “bluer” than one might have thought, with democrat-to-republican flips happening in Virginia (2), South Carolina, Florida (2), Georgia, and Texas (2 thusfar).
As noted, Mr. Allison’s work is interactive, and I highly recommend you read his entire piece. It’s a great article on both politics as well as data representation.


