REIT Report — Adaptive Re-Use
Last week I talked about the industrial sector. I’m hoping to alternate sector analyses with reports about the REIT market in general. Today, the issue of adaptive re-use has caught my attention, and if you are an active REIT investor, it should be of some interest to you as well.
For the uninitiated, adaptive re-use is the repurposing of buildings for some use that has more demand in the current market. For example, I visited some old “rust-belt” cities in the mid-west with underused early 20th Century brick industrial buildings. Many of these buildings had great bones and were often near the more vibrant and transitioning downtown areas. With some brownfield redevelopment assistance, these buildings were repurposed as mixed-use residential, office, and light retail centers.

The Pratt Street Power Plant in Baltimore was converted to retail, restaurants, and office uses.
REITs are working with cities to develop incentives for this redevelopment, such as flexibility in zoning and use requirements. For example, city zoning may be extremely restrictive for office use, but such buildings may be in the right place, and highly adaptable, for light retail, medical laboratories, and even schools.
Prologis (PLD), a REIT I discussed last week, recently issued a report that office-to-logistics conversions are likely in areas with high land cost and limited competition. However, cities need to incentivize by reviewing zoning, entitlement, permitting, and approval delays.
According to Dennis Shea, the executive director of the Terwilliger Center for Housing Policy, key elements include zoning reform, tax abatements, tax incentives, and regulatory reforms. “For example, in Washington, DC, the city relaxed the requirement that certain percentage of construction workers on projects that receive government funding be D.C. residents. They’re also offering a 20-year property tax break to developers who convert commercial buildings to residences.
In San Francisco, in June, city agencies issued a request for information to identify potential sites for adaptive reuse, estimate their feasibility for a conversion, and evaluate regulatory barriers to the projects. In July, Boston announced the Downtown Office to Residential Conversion Pilot Program, reducing property taxes for up to 29 years for commercial properties who converted to residential. California has allocated $400 million for the next two years to encourage adaptive reuse. A further proposal will limit fees, prevent parking requirements, and streamline the approval process if the conversions include an affordable housing component.
In New York City, the Office Adaptive Reuse Task Force recommended a new tax incentive that could create 20,000 new housing units over the next decade. This includes rezoning certain areas in Manhattan to allow residential buildings, streamlining conversion policies to make more buildings eligible, and eliminating parking regulations. Mayor Adam’s and the Department of City Planning laid out a plan to convert vacant offices into housing as part of the “City of Yes” plan. They are also launching an Office Conversion Accelerator to expedite complex office-to-housing conversion projects.
Five projects were recently selected by Chicago for conversion from office to residential use with tax increment financing, grants for retail businesses on the ground floor, low-income housing tax credits, and historic tax credits.
The federal government is also stepping in to encourage adaptive reuse, with the Neighborhood Homes Investment Act to loosen restrictions on density and provide tax credits. the Biden administration announced a working group to leverage federal funding to support commercial to residential adaptive reuse projects. Also, the General Services Administration (GSA) is reviewing underutilized federal buildings for conversion to housing, and HUD is funding research on how to make conversions less costly.
“For a successful adaptive reuse project, you need real estate in a prominent location that’s supported by income growth to sustain the rent, plus you need to be able to convert the property in a way that makes it attractive,” says Shawn Tibbetts, COO of diversified REIT Armada Hoffler Properties (AHH). “It’s not just the right building, it has to be the right market.” His REIT converted the former Dominion Energy headquarters in downtown Richmond to a 174-unit multifamily property using tax credits. They lso converted Chronicle Mill, a former textile mill outside Charlotte, into a mixed-use development, also with tax credits and support from the local government.
“At Chronicle Mill we were able to combine adaptive reuse with a new adjacent building, which also helped make that project financially viable,” Tibbetts says. “Along with the rehabilitation, adding a new building helped lower the overall cost per unit, plus it is an incentive to the city since they gain more taxable property.”
In Rockville, Maryland, for example, BXP (BXP) acquired 31 acres with seven offices that will be demolished and replaced with purpose-built lab space and multifamily housing. “The I-270 corridor is the epicenter of the life sciences market and the office buildings on this site are obsolete,” says Pete Otteni, executive vice president and co-head of the Washington D.C. region for BXP. The location is already amenitized with transportation, shops, and restaurants, so it’s the right kind of environment for us to develop a sense of place.” In Herndon, Virginia, BXP acquired a 10-acre site with 350,000 square feet in two vacant office buildings. They are applying to rezone the site for residential use to allow for 350 apartments and 101 townhouse units.
Despite increased interest, in July the Adaptive Reuse Report from Yardi Matrix reported that in 2022 the conversions of offices dropped 15% from the previous year, to a 10-year low. Nonetheless, Yardi also found that future adaptive reuse projects in the pipeline includes 122,000 converted apartments, compared to 77,000 apartments in the pipeline in 2022’s report. Office conversions are expected to represent 37% of the total, followed by hotels (23%) and factories (14%). Hotel conversions were more popular than office conversions in 2022, and the number of apartments converted from hotels rose by 43% compared to 2021, primarily for affordable housing.
While challenges remain for adaptive reuse, public-private partnerships and concern about revitalizing downtown cores are likely to push developers to find creative solutions for vacant commercial buildings.
Thanks to Michele Lerner writing for NAREIT for most of this information.
Once again, I’m not an investment advisor, and this is not a solicitation or recommendation to invest in anything. Further, I and the entities I’m involved with may have positions or interests in one or more of the securities discussed here. However, if you have any questions about this, please don’t hesitate to reach out.
John A. Kilpatrick, Ph.D., MAI
Share this:

REIT Report — Industrials
As regular followers know, I track the REIT universe pretty closely, and we have a REIT-based fund called ACCRE. In the past, I’ve reported on ACCRE’s performance, but I’ve been encouraged to report on the broader REIT market.
I’ve decided to take this one sector at a time, and today we’ll look at the industrials. The sector has generally been strong from a fundamentals perspective, but investors enjoyed some great returns in this sector during and immediately following the pandemic “reset”, and as such returns have overall been flat for the past year. I’m presently tracking ten industrial REITs, with one-year performances all over the map:
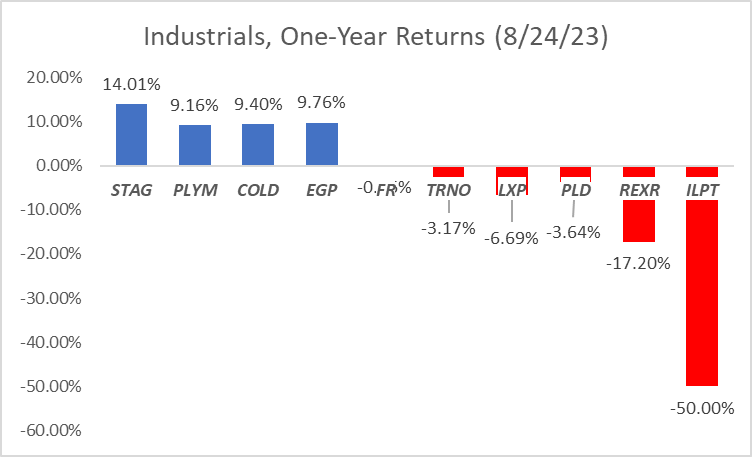
Stag Industrial (STAG) leads the pack with a one-year return of 14.01%, although interestingly enough has only shown sluggish returns over the last 5 years (26.1% net). STAG owns 111.1 million square feet of traditional industrial space spanning 558 buildings in 41 states. In July, they reported $0.29 in net income per share for the 2nd quarter, compared to $0.18 for the same period in 2022. NOI increased 4.3% (again, compared to the same period in 2022) and same store cash NOI was also up by 4.5%. They enjoy an occupancy rate of 97.7% and had a retention rate of 79.6% on leases expiring in the 2nd quarter.
Plymouth REIT (PLYM) shares have increased 9.16% over the past year and 40.36% over the past 5 years. They own 34 million square feet spanning 210 buildings in 13 markets, mainly in the eastern US. They have a portfolio occupancy of 98%. For the 2nd quarter ending June 30, they reported a net loss of $0.08 per share, compared to a net loss of $0.17 per share for the same period last year. Same store NOI increased 3.5% compared to the same period last year.
Americold Realty Trust (COLD) shares increased 9.4% over the past year and 31.81% over the past 5 years. They specialize in cold storage warehouses and have 243 such facilities in North America and Europe. For the 2nd quarter of this year, they reported total revenue decreasing by 11% and a net loss of $0.39 per share. However, core EBITDA increased by 12.1%, NOI increased by 14.5%, and same store revenues increased by 2.8%.
Eastgroup (EGP) enjoyed a 9.76% share price rise over the past year and 82.75% over the past five years. EGP focuses on multi-tenant business distribution buildings, with 55 million square feet in 11 states across the sunbelt. Seventy-nine percent of their portfolio is in California, Texas, and Florida. Their “sweet spot” is in the 15,000 to 70,000 square foot range. Earnings per share for the most recent quarter was $0.97 compared to $1.09 for the same period last year. However, funds from operations increased to $1.91 per share, compared to $1.72 the same period last year. Their operating portfolio is 98.5% leased and 98.2% occupied.
First Industrial Realty (FR) shares declined 0.6% year over year but have risen 58.9% over the last 5 years. They operate 69.4 million square feet of traditional industrial properties spanning 444 buildings widely scattered across the U.S. Net income per share for the 2nd quarter was $0.41, down from $0.88 for the same period last year. Funds from operations per share was slightly up, at $0.61 per share compared to $0.56 per share last year. Property occupancies stand at 97.7%.
Terreno Realty (TRNO) shares have fallen 3.17% over the past year and 56.7% over the past 5 years. they own and operate traditional industrial properties (mainly warehouse/distribution) in six coastal U.S. markets (Seattle, San Francisco, Los Angeles, New York/New Jersey, Washington DC, and Miami) with a focus on infill properties. They own 257 buildings with 15.9 million square feet. Occupancy was 97.8%. Terreno considers its competitive edge being in an established position in markets that have large and growing consumer populations, highly developed transportation infrastructures, and significant physical and regulatory barriers to development. Their largest customers include Amazon (3.6% of total) FedEx (2.1%) and O’Neill Logistics (1.8%. For the 2nd quarter of this year, they reported $0.48 in net income per share, compared to $1.28 for the same period last year.
LXP Industrial (LXP) shares declined 6.69% over the past year and only grew 3% over the past 5 years. LXP focuses on single-tenant industrial properties. They own/operate 109 properties spanning 52.5 million square feet which are currently 99.5% leased. Almost all of their properties are in the eastern half of the US, plus some investments in Phoenix and Portland. they report average annual rent escalations of 2.5% and an average portfolio age of 8.8 years. LXP reported net income per share of negative $0.03 for the 2nd quarter, down from $0.14 per share for the same quarter last year. Total revenues were actually up, but property operating expenses and impairment losses (generally a paper loss) were substantially increased. Net operating income actually increased about 10%. Notably, LXP was one of the stars in the industrial sector from 2019 until early 2022, with a share price nearly doubling. However, since Spring of last year, the price has languished significantly.
Prologis (PLD) is the 1000 pound gorilla in this sector, but its price has declined by 3.64% over the past year. That said, investors over the past 5 years have enjoyed a price increase of 82.58%. Prologis owns and operates 2,926 properties throughout the Americas, Europe, and Asia totaling 619.5 million square feet. The aggregate book value of their real estate holdings as of the end of June was $76.5 Billion. They reported $1.31 per share in earnings for the 2nd quarter, up from $0.82 for the same quarter last year. Total operating income increased by 165%.
Rexford Industrial (REXR) stock declined fairly steadily over the past year, losing 17.2%. That said, like other industrials, it performed very well over the past five years, up 61.15% overall. Rexford is focused exclusively in Southern California with about 44.5 million square feet of traditional industrial warehouses averaging about 98.1% occupancy. For the 1st quarter of this year, Rexford reported earnings per share of $0.30, compared with $0.27 during the 1st quarter of 2022. Total rental income increased by about 32%. However, much of this increase was funded by increased debt — about $300 million in the first quarter alone. A significant portion of the interest expense reported int eh 1st quarter came from losses in interest rate hedges. However, they believe that forward hedges will serve them well in the coming 12 months.
Industrial Logistics (ILPT) has declined 50% over the past year, and 83.8% over the past 5 years. ILPT owns 413 traditional warehouse properties in 39 states totaling 60 million square feet with 99.1% occupancy. However, about 38% of ILPTs revenues come from 226 properties, including long term ground leases, buildings, and easements on the island of Oahu. ILPT reported negative net income of $0.40 per share for the 2nd quarter, which was an improvement from negative $2.20 the same quarter last year. A substantial portion of the loss last year was from recognition of non-cash impairment of real estate. Notably, interest expenses run about 70% of total rental income.
In coming weeks, I hope to cycle thru various sectors, alternating with some general considerations about REIT investing. Naturally, I’m not an investment advisor, and this is not a solicitation or recommendation to invest in anything. Further, I and the entities I’m involved with may have positions or interests in one or more of the securities discussed here. However, if you have any questions about this, please don’t hesitate to reach out.
John A. Kilpatrick, Ph.D., MAI
Share this:

Shelter Inflation
The Federal Reserve Bank of San Francisco published a great piece on shelter inflation today (that is, home ownership and rental costs, which are heavily related). If you’d like to read the piece, you can download it here.
In short, even though core inflation is falling, shelter inflation has remained high. i would note that real estate researchers have long recognized that real estate prices (both rents and costs) are sticky upwards. That means that while prices/costs of real estate are quick to move up, they are sluggish to move down. There are a lot of structural reasons for this.
The FRBSF noted that house prices and asking rents went through a period of extraordinary growth starting in early 2020, and the growth rate slowed sharply in 2023 but did not turn into a decline. Notably, shelter costs are a component of the consumer price index, so inflation tends to be doggedly sticky even as other components of the CPI are relaxing. As a case in point, the FRBSF uses the following graphic to illustrate the problem:

Data courtesy the Bureau of Labor Statistics and Haver Analytics
Excluding shelter costs, inflation is nearly back to the FED’s target level of 2%, and in fact below other central bank targets of 3%. However, the shelter cost component is driving core inflation up to levels that the FED simply won’t (and shouldn’t) tolerate.
Part of the problem is how we actually measure shelter inflation. The CPI component includes lagged effects, and is not sensitive to current asking rates (either rents or current prices), as the FRBSF demonstrates in the following graphic:
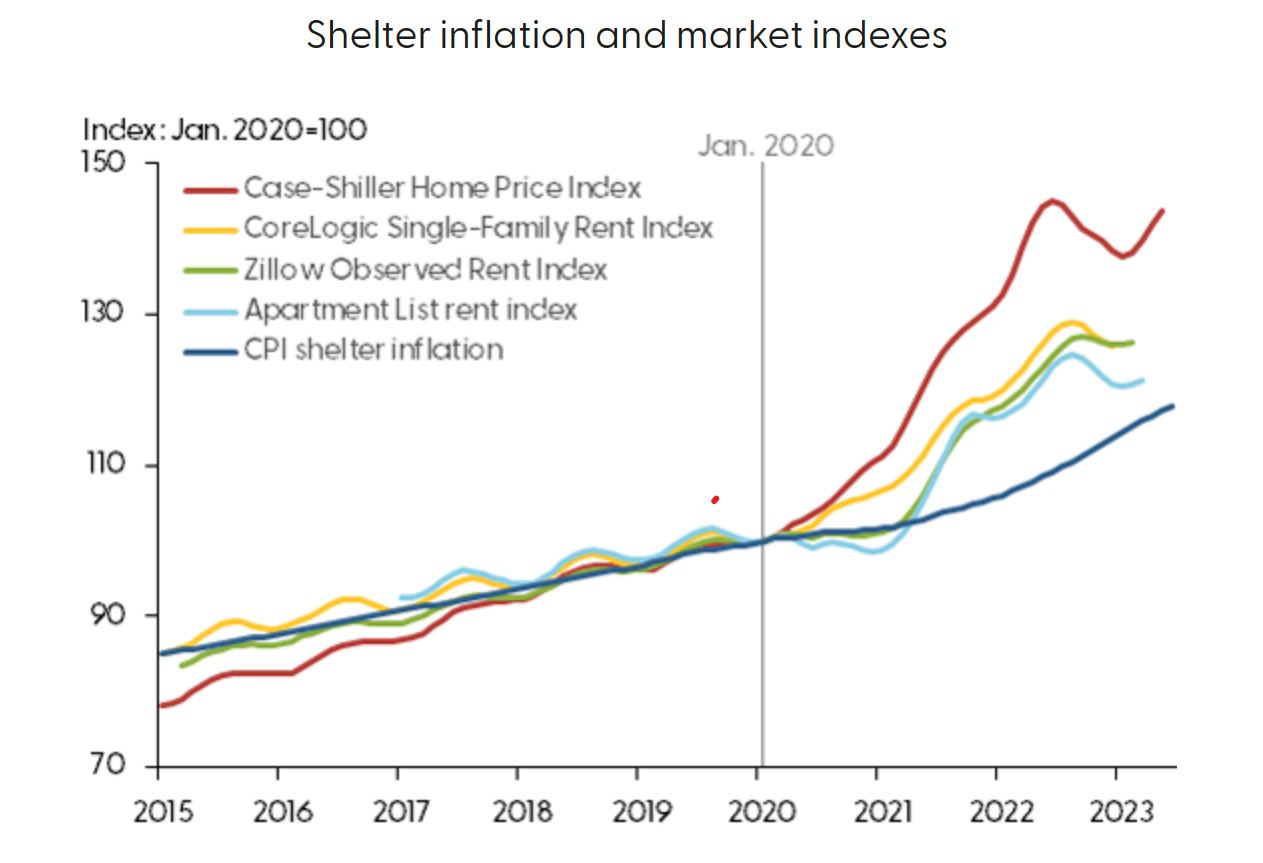
Data courtesy the Apartment List, CoreLogic, S&P/Case Shiler, FRED, and Zillow
The article suggests that shelter inflation should amelorate, and they predict that by mid-2024, shelter year-over-year shelter inflation should actually turn negative. However, for the remainder of this year, and early 2024, we should still see increasing housing costs both in rentals and in the home ownership arena.
One caveat, though — the authors note that shelter costs are difficult to project, and in fact some models have shelter costs changes over time declining but not turning negative. Nonetheless, none of the models currently project shelter costs increases at higher rates than we’re currently experiencing.
As always, if you have any questions about this or any other real estate topics, please don’t hesitate to reach out. Best wishes,
John A. Kilpatrick, Ph.D., MAI
Share this:

Travel Stats and Real Estate
It’s widely recognized that, in major American cities, the central business district (CBD) office market suffered greatly during and as a direct result of the pandemic. There have been spin-off impacts for CBD retail, as down-town workers are no longer there to shop on their lunch breaks or to dine in street-front cafes and restaurants. Worker-bees quickly adapted to work-from-home, with tools like Zoom and Teams and others proliferating, and a parallel expansion of broad-band facilitating all of that. Now that the pandemic has receded, few seem anxious to return to the commute-and-work grind.
Arguments abound over the efficiency and efficacy of “work from home” versus “work in a cube farm”. Most managers seem to agree that there may be room for a balance — say 3 days per week in the office? Two? It depends a lot on the nature of the work, but still there is widespread agreement that we have too much CBD “B” grade office space right now, and perhaps too much ancillary space (e.g. — street front cafes) as well.
It’s hard to get a handle on exact statistics about office utilization. Many big cube-farms are tied up in long-term leases, and while some building owners and managers use technological tools like elevator trips and key-car swipes, they are also loathe to disclose actual data. This isn’t a trivial problem, since most of these affected buildings are financed and/or have institutional ownership. Real estate finance, development, and long-term utilization trends are all in the balance.
One bit of data that just came across my desk was a graphic I found from Statecraft.com (a California-based political software company), which tracks the utilization of mass transit across many of the nation’s top transit authorities as well as the national average. For comparison purposes, ridership is normalized to 100 as of the onset of the pandemic. The results are revealing.
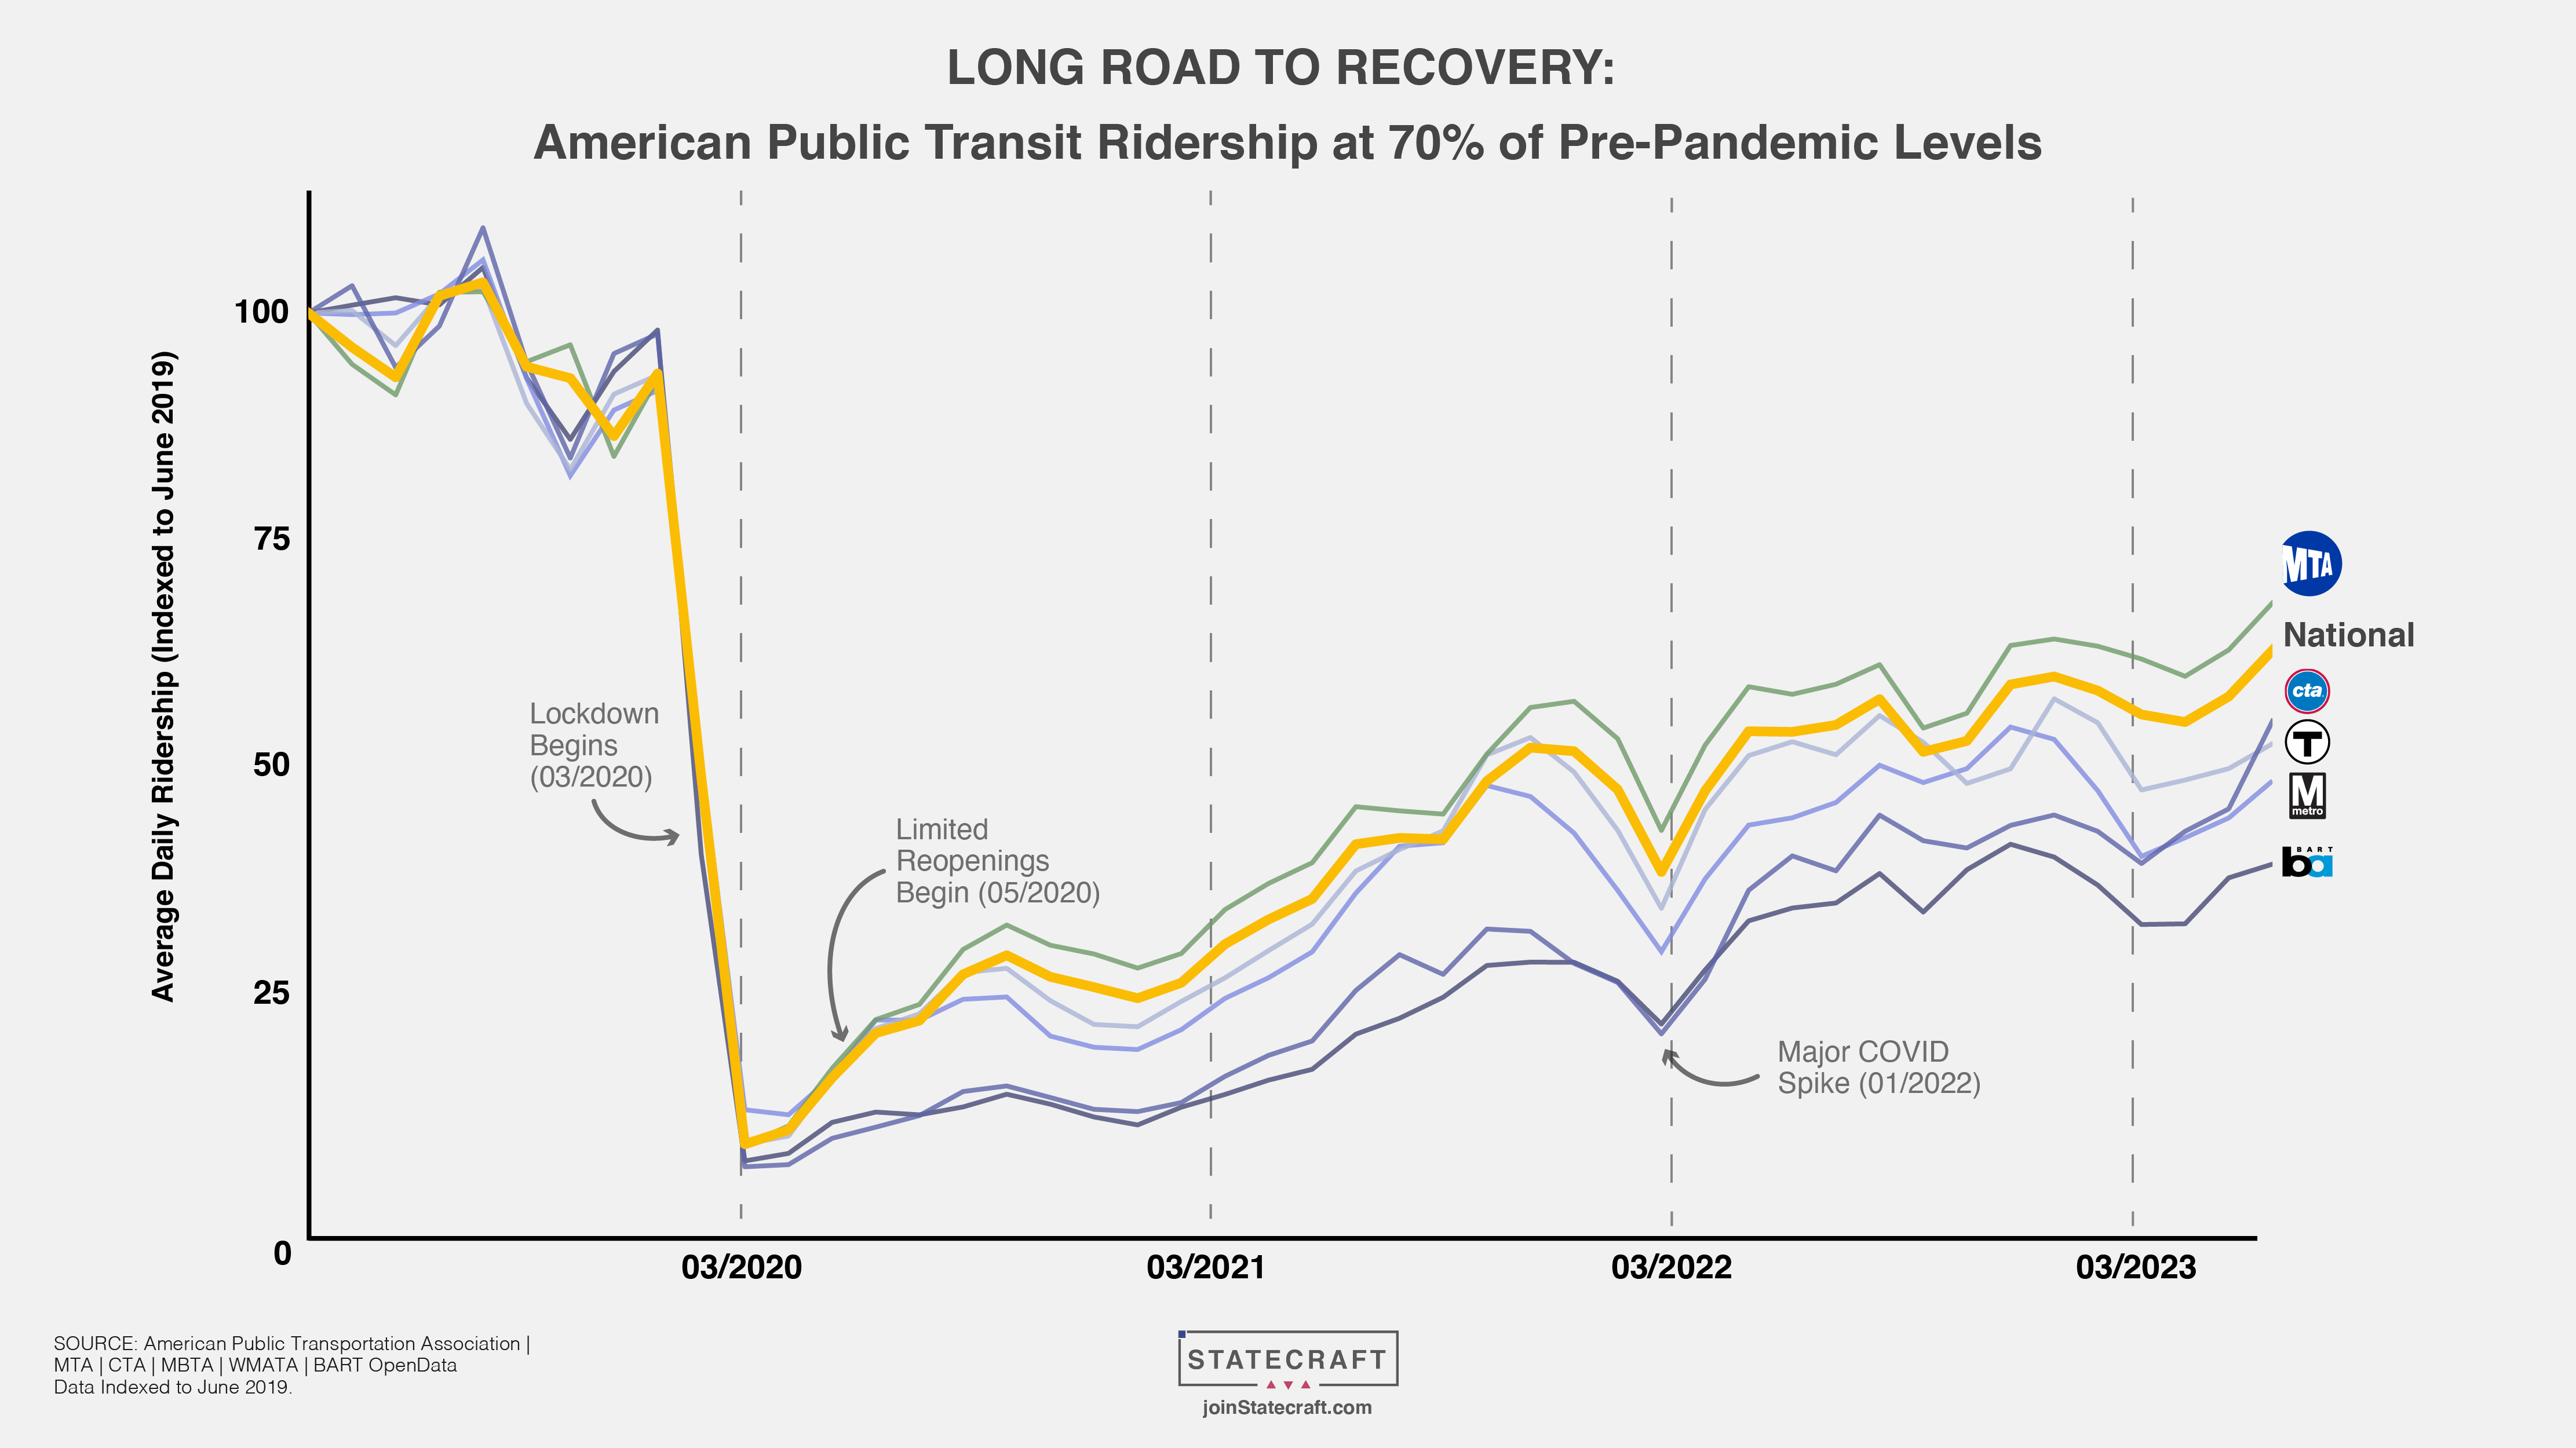
Nationally, we’re at about 70% of pre-pandemic ridership NYC’s MTA leads the list with slightly under 75%, while San Francisco’s BART is turning in an anemic ridership less than 50% of former levels.
Naturally, this has enormous implications across numerous economic and public policy sectors. In my own home base of King County, Washington, for example, we’ve made enormous investments in public transit for riders who may not be back for a long time to come. However, from a purely real estate perspective, these riders used to occupy offices, stores, and shops in the downtowns of our major cities. thirty to fifty percent of them aren’t there now, and that means the space they used to occupy has only marginal productive value.
As usual, I enjoy hearing from you. If you have any questions or comments, please let me know.
John A. Kilpatrick, Ph.D., MAI
Share this:

What the Heck is Happening to REITs?
I’ve long been a proponent of REITs as a component of a well-balanced portfolio, and our fund, ACCRE, is made up entirely of publicly traded REIT shares. Over the last 20 years (and you really have to take a long-term view in portfolio structures), the FTSE/NAREIT All-Equity REIT index has grown by 9.25%, compared to 9.85% for the Dow and 10.02 for the S&P-500 (all indices assume reinvestment of dividends).
However, over the past 5 years, we’ve had the very serious societal disruptions of COVID, the Russian invasion of Ukraine, and re-emerging inflation. Non-REIT stocks have proven surprisingly facile at riding these roiling markets, particularly on-line retailers (Amazon, WalMart), tech stocks, and companies that actually benefit from people staying home (Roku and Netflix immediately come to mind). Specifically, equity REITs enjoyed a total return of 6.2% over the past five years, compared with 11.45% for the S&P and 9.49% for the Dow.
Arguably, there have been some bright spots in the REIT universe over this period, including single-family rental REITs, and after the huge COVID melt-down, a nice rebound in the hospitality sector. Indeed, 2021 saw a huge return in the overall REIT index (39.88%) but was followed by a terrible negative 25.1% last year. Thus far in 2023, equity REIT total returns have been an anemic 2.05%, compared with 9.17% for the S&P year-to-date.
So, what gives? In no small part, REITs suffer from what they are, namely portfolios of income producing real estate. Some of that real estate has suffered from cyclical issues (hospitality, movie theaters) only to fight back to some semblance of normalcy. Other sectors (office, some types of retail) may be in a long-term systemic decline. Neighborhood strip shopping centers have actually done quite well, anchored by ‘necessary’ businesses such as grocery stores and pharmacies, and the industrial sector has done very well. Apartments did well for a while, but there are signs of over-building in that sector. Single family residential rental, which was a darling for a while, now suffers from astronomical costs and labor shortages.
Not surprisingly, the REIT IPO market has been dead this year, with exactly zero offerings year-to-date (through the end of April). Indeed, the last REIT IPO was back in 2021 However, there have been 10 secondary common offerings, raising almost $3 Billion, and 16 secondary debt offerings which raised almost $12 Billion. For comparison, there were 66 secondary common offerings in 2022 which raised over $20 Billion. Clearly, there continues to be some interest for ‘new money’ to come into the REIT universe.
As mentioned, industrial REITs continue to be the bright-spot in the REIT index, with 12 industrial REITs averaging a total return of 9.39% thus-far in 2023 (data as of the end of April). The biggest loser has been the office sector, down 18.08% so far in the year. Based on my conversations with some REIT analysts, the softest area seems to be in B-properties in the CBD.
Single family home residential posted negative numbers last year, but that sector has rebounded 12.69% thus-far this year. I would note that there are only two such publicly traded SFR REITs in the index, and the 2022 pull-back was a rebound from their huge — and probably unsustainable — 2021 gains. I’m glad to see this small sector gaining ground again.
Self-storage is back in positive territory, showing a 10.02% gain thus far in 2023.
All of this information comes from NAREIT’s monthly data publication, REIT Watch. If you’d like your own copy, click here or visit NAREIT’s web site for even more data.
Best wishes to you all, and as always, if you have any questions about real estate, please don’t hesitate to reach out.
John A. Kilpatrick, Ph.D., MAI
Share this:

Should Banks Be Allowed to Fail?
Today (March 27, 2023) I awoke to the news that First Citizens Bank of Raleigh, NC, has purchased failed Silicon Valley Bank. As of December 31, First Citizens had 550 branches in 23 states with total assets of $109 Billion. Silicon, by contrast, had only 16 branches, all in California, with $209 Billion in assets, and was the 16th largest bank in the U.S. First Citizen’s stock rose 47% on the news, suggesting that investors thought this was a good idea. The ins and outs of this merger would require more than one volume, and I won’t trouble you with it here.
More to the point, though, is the question which is reverberating around the interweb this Spring, to wit, should banks be allowed to fail? That, of course, begs the question, what do we mean by ‘fail’?
It’s helpful for a minute to consider that a bank is a financial intermediary. It’s not a business, in the normal sense of the word, in that it doesn’t actually produce anything. It takes deposits and makes loans. That’s kinda it.
Now, consider the typical bank’s balance sheet. (I realize this is getting into introductory accounting, and I apologize if you need to google “balance sheet’). On the left hand side — the assets — there are primarily two things: cash and loans. You may not think of a loan as an asset, but the bank does. The bank has a loan to an entity and expects to be paid back. Banks are traditionally pretty good at figuring out what percentage of those loans will go ‘bad’. W-a-a-ay back near the dawn of human civilization, when I earned my MBA, traditional banks, like First Citizens, figured that out of an average pool of business loans, after thorough review and underwriting, about 2% would go bad. Hence, all of the loans paid an interest rate that was slightly higher so that the good loans provided, in essence, an insurance on the bad loans. Cash was held just to facilitate day-to-day business. For example, on Friday, a bank would like a lot of cash to handle paychecks. (This is also true at liquor stores. Go figure…)
An old joke from back in those days was the 3-6-3 rule of banking. You paid your depositors 3%, you charged your borrowers 6%, and you were on the golf course by 3pm.
Some of these ‘loans’ are actually bonds. Many of the bonds are U.S. issues, like treasury bonds and mortgage-backed securities. These are considered 100% safe, and the Federal Reserve can require national banks to carry certain quantities of these as part of the FED’s monetary policy, but I’m getting off base here. (Next time some university invites me to teach Advanced Money and Banking, you’re all invited to attend.)
On the right-hand side of the balance sheet there are liabilities. The uninitiated may consider this to be highly ironic, but ‘deposits’ are the primary liability. Banks sometimes issue bonds, but generally, the right-hand-side liabilities are commitments to depositors. Also, on the right-hand side of the balance sheet is the ‘owners’ equity’ (the net worth of the bank, equal to the book value of what the shareholders own). Hence, the sum total of the assets, on the left side, minus the liabilities (mostly depositors’ balances), on the right side, equals the book value of the shareholders wealth.
Sigh… now let’s get to the heart of the matter. A bad mix of stuff on the left side often causes bank failure. Cash-on-hand is worthless to a bank — it produces nothing, but just sits around in the tellers’ drawers to facilitate withdrawals. However, if depositors get scared that the bank is mismanaged, they may want to withdraw their funds and move them to a safer bank. Hence, a ‘run’ on the bank (the sort of liquidity crisis that brought down Silicon Valley) can require the bank sell assets (bonds and loans) at fire-sale prices to generate cash and keep depositors happy. That’s what happened in California. Silicon had made a conscious decision to invest in low interest rate assets (bonds and loans) and when interest rates rose, they had to sell those assets at a loss to satisfy depositors. Ironically, even if a bond goes down in market value, because of a rise in interest rates, if it’s a solid asset, it will probably eventually pay off at 100 cents on the dollar. (At this point, it would be handy to re-watch the movie “It’s a Wonderful Life”).
Historically, on the right-hand side of a balance sheet, most of the customers of depository institutions have balances under $250,000. If all of them did, and if it was an FDIC insured institution (as nearly all are), then a liquidity crisis or a collapse of some of the assets (as happened with mortgage-backed securities in the 2010 era) would result in the gub’ment stepping in, making good on all of the deposits, and letting the shareholders get wiped out. The FDIC and other regulators would assay the value of the assets, and sell them (essentially, sell the bank) to some institution which would service the depositors (that is, assume the liabilities) and collect on the assets as they matured. The shareholders would get wiped out. Welcome to capitalism.
However, in the 21st century, $250,000 caps on depository insurance are a thing of the past. For one, many businesses need huge depository balances just to provide day-to-day working capital. Payroll for even a medium sized business (say, 1000 employees) can run $1 million a week. I serve as treasurer of one small entity and on the investments board of another, and both have these problems with excessive cash-balance needs. Aggressive cash management can mollify some of the risk (say, rolling cash into t-bills daily) but for many small and medium entities, this just isn’t a good option. Historically, the FDIC has insured 100% of deposits up to $250k and provided some sort of de facto guarantee (often 80%) on deposits above that threshold. It was that latter risk that caused Silicon’s demise.
Should the FDIC insure all deposits irrespective of size? At that point, a bank’s liabilities become Federal liabilities, and we have effectively nationalized our banks. However, we end up there anyway, because to do otherwise would be to cause undue lack of confidence in our banking system.
These are not trivial question. If 100% of deposits are insured, then banks would, in effect, not be allowed to fail. However, there would be no yin-yang of risk/reward associated with being a bank investor.
Do I have an answer to this question? Nope, but it’s perhaps the overriding question in our financial system today.
John A. Kilpatrick, Ph.D., MAI — john@greenfieldadvisors.com
Share this:
A New Tool for REIT Investors
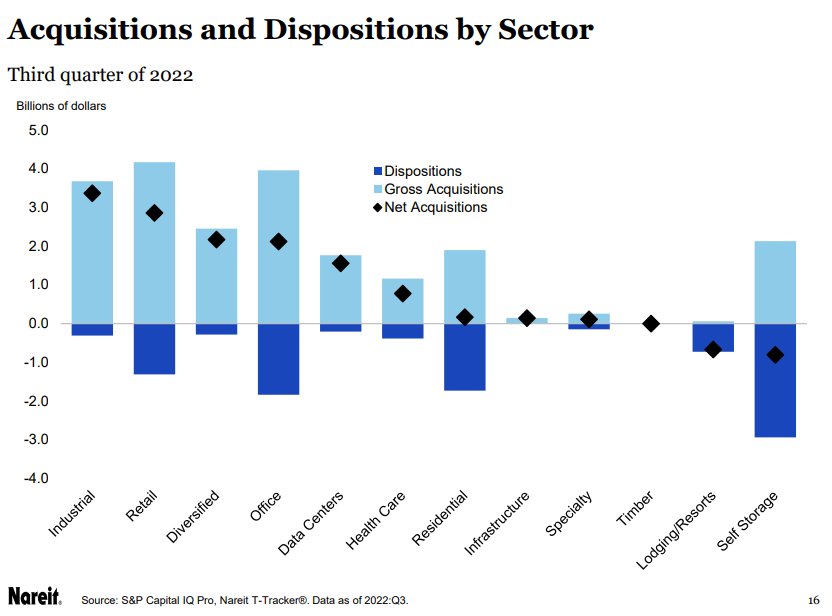
The National Association of Real Estate Investment Trusts (NAREIT) has rolled out a new quarterly publication called the NAREIT T-Tracker Results. Designed for the serious REIT investor or researcher, it lays out in significant detail comparative data on three important indicators: Funds from Operations (FFO), Net Operating Income (NOI), and Dividends Paid. It then goes on to report comparative data on a host of secondary measures, such as Same Store NOI (SS NOI), Occupancy Rates, Acquisitions and Dispositions, the Development Pipeline, Total Property Holdings, Price to FFO Ratios, and miscellaneous other financial indicators. The T-Tracker breaks down data by REIT sector and reports on a quarterly basis. The most recent issue, released in November, was for 3-Q 2022. We expect 4-Q 2022 data later this month. Data is also presented graphically over a multi-year time frame (broken down quarterly) to aid in spotting trends by sector.
For example, the key FFO metric has shown decidedly upward trends across the REIT universe for the past twenty years, with noteworthy declines surrounding the 2009-10 recession (with negative FFO in the industrial sector in three quarters) and several quarters of negative FFO in the hospitality sector during the pandemic.

By comparing both longitudinal trends and cross-sectional data across sectors, some interesting patterns emerge. For example, for about 20 years, property acquisitions have generally (but not always) exceeded dispositions, although there is no discernable trend over time.
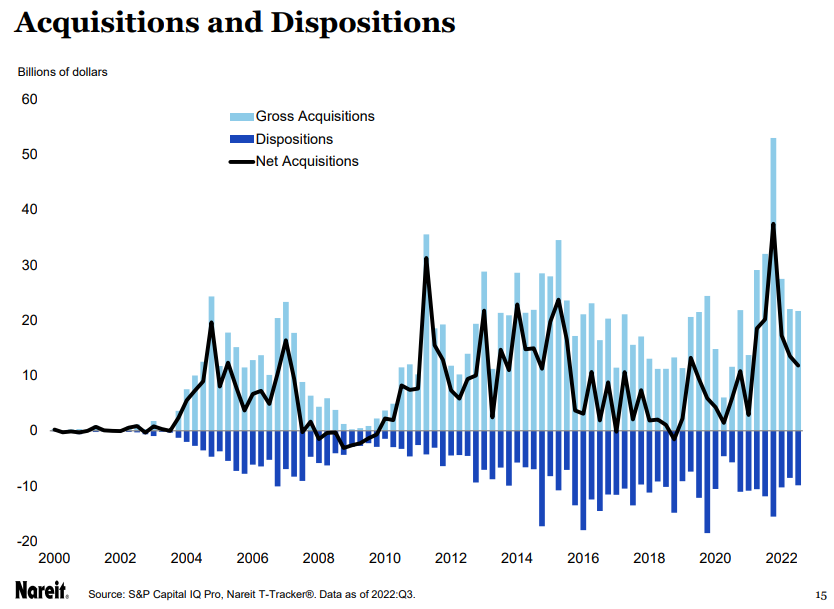
However, when we break this down by sector, different patterns emerge. Somewhat surprisingly, the largest number of dispositions in 3-Q 22 were in the Self-Storage sector, and while Lodging/Resorts was almost entirely marked by dispositions, the aggregate value of those dispositions was only about a third of that seen in the Self-Storage arena.
I’ll keep you informed when the 4-Q 2022 data comes out. While this may seem like so-much inside baseball for REIT geeks, the importance of real estate in a well-balanced portfolio cannot be overstressed. All too many investors and investment advisors really do not understand the real estate sector, and the T-Tracker will go a long way to help with that.
As always, if you have any questions about this or any other real estate economics/finance topic, please let me know!
John A. Kilpatrick, Ph.D., MAI — john@greenfieldadvisors.com
Share this:

Real Estate: 2023
I’m regularly asked, “Is now a good time to buy real estate?” Throughout 2022, my pat answer was, “Now is a good time to have already owned real estate.” Indeed, with the possible sector exceptions of hospitality and retail, real estate was a pretty darned good hedge against the stock market doldrums over the past year. As soon as I say that fingers get pointed at the REIT market, which has had mixed results this year. Indeed, some REIT sectors were terribly over-bought, and some specific stocks (I’m looking at single family residential REITs) simply couldn’t deliver funds-from-operations to meet investor expectations. Nonetheless, and overall, having some real assets in your portfolio at the beginning of 2022 was a pretty good thing.
So where do we go from here? Obviously, forecaster expectations need to be taken with huge grains of salt, but to an extent these forecasts often drive the narrative. In other words, in a behaviorist market (which is is, you know), investors tend to be herd followers. So which way is the herd pointing?
On the housing front, over at the National Association of Realtors, Melissa Dittmann Tracey writes “2023 Real Estate Forecast: Market to Regain Normalcy“. By this, she forecasts that actual sales volumes (that is, number of homes sold) will decline by about 7% but with flat prices overall. Two things strike me about this. First, by our research at Greenfield, since World War II, home prices in America have increased on average by about 2% per year above the inflation rate. This is more-or-less baked into the expectations of market participants and, for that matter, even market intermediaries like mortgage lenders. Thus, when faced with 5% inflation, we expect home prices to rise about 7%. Second, though, this is an average over a very long time horizon, with wild fluctuations. Remember the market meltdown in 2010? Remember the market bubble that preceded that melt-down? Now, consider that according to NAR statistics, home prices rose an estimated 9.6% in 2022 (the exact figures are still out), a whopping 16.9% in 2021 and 9.1% in 2020, all during periods of low inflation. NAR estimates that in the year coming, 2024, inflation will be back to “normal” (and most forecasters agree with this) and home prices should get back to a healthy upward trend (NAR forecasts a 5% price rise in 2024). Thus, if they are right, then 2023 could be a good year to shop for bargains.
New home sales are factored into total home sales but are also a driver of land development activity. According to a U.S. Department of Housing and Urban Development report, released in December, new home sales cycled downward starting in early 2020, from a seasonally adjusted rate of just under 1 million per year to a low of about 600,000 in early 2022, with higher construction costs carrying the blame. Notably, the 2020 numbers were well above the intermediate term trend line. However, for most of 2022, this rate seems to stabilize, and this month the National Homebuilders will conduct their annual survey of builder sentiment. We’ll see how that turns out.

Al Brooks, head of commercial real estate at JP Morgan, suggests that “there may be challenges ahead“. Big macro-economic factors are at work, not the least being the obvious geopolitical problems (the War in Ukraine and sanctions against Russia), inflation coming in at 7.75% in October, and rising interest rates. He projects a mild-to-moderate recession this year, affecting all asset classes, with a full recovery spanning years rather than months. Notably, they find that the multifamily sector is doing well, with vacancies at a five-year low of 4.4%. Demand for affordable workforce housing “far outweighs supply.” He also sees good long-term trends in the industrial sector, which follows the growth of e-commerce. Retail is a mixed bag, according to Brooks, depending largely on location and category. For example, groceries and other neighborhood shopping are doing well, but city-center retail has been “slow to bounce back.”
Brooks goes on to note that the future of office buildings is “up in the air.” However, none of the regions in have seen vacancy rates dip below their pre-pandemic levels. He quotes his colleague Anthony Paolone, a JP Morgan senior analyst and co-head of U.S. real estate stock research, as saying, “we think cash flow growth will be challenged in the office sector.”
Conversely, in September, Deloitte released their 2023 commercial real estate outlook. They surveyed 450 CFOs of major commercial real estate owners or investors and found that while there are “near term performance reservations”, long-term optimism remains. North American respondents to the survey listed logistics and warehousing spaces as their top pick for Investment, while Europeans favored surburban offices and Asian-Pacific respondents favored properties tied to the digital economy.
Finally, one of the perennially most interesting sectors is self-storage. In recent years, there has been a fascinating growth in the niches of this market, with facilities specializing in art storage, wine storage, and even classic/collectable car storage. Self-storage in general enjoyed explosive demand during the pandemic as a result of the work-from-home trend. Going into 2022, it was expected that self-storage would stagnate in no small part due to rising costs. However, rents actually increased faster than costs in the past year, and sector prices now stand 65% higher than pre-pandemic levels, with occupancies averaging 95%. Green Street expects a downtrend in new offerings this year, facing continued labor and materials shortages, but new construction is expected to rebound in 2025.
Well, that’s all for now, folks. As always, if you have any questions on these or any other related topics, please let me know.
John A. Kilpatrick, Ph.D. — john@greenfieldadvisors.com
Share this:

Survey of Professional Economists
Every quarter, the Philadelphia FED surveys a team of professional economists on the “headline” topics of the day — GDP Growth, Unemployment, and Core CPI change topping the list. Naturally, 2022 has brought some very real updates to every model out there.
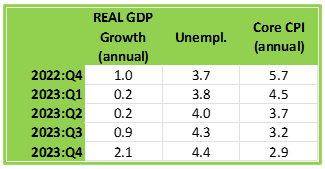
For the 4th quarter 2022, which we’re now in, the consensus agreement is that REAL GDP should grow at about 1.0 percent on an annualized basis, which is not much but certainly not “recession”. The consensus opinion is that REAL GDP will be nearly flat in the first half of 2023, then rising slowly to an annualized rate of 2.1% by the end of next year. For the uninitiated, something between 2% and 4% is usually considered to be a healthy, stable rate for a mature economy. Emerging economies, like China, need growth rates double that or more. Two quarters of negative GDP growth signals a recession.
Unemployment is currently hovering around 3.7%, and the consensus opinion among professional economists is that unemployment will stay relatively stable for most of the coming year, inching up to about 4.4% by the end of next year. For context, back when I was a boy, we were taught that frictional unemployment (that is, people between jobs, job seekers, etc.) was somewhere between 3% and 6%. Unemployment under 3% was usually a signal of impending inflation, and above 6% was a sign of economic weakness. However, those rates may be completely disconnected from reality in current times.
Core CPI (this is better known as the “inflation rate”) should be growing by an annual rate of 5.7% at the end of this year, but you probably already knew that. Economists think this will slowly decline, back to a reasonably healthy 2.9% by the end of next year.
If and as these change, I’ll keep you posted. Otherwise, if I can answer any questions about this, please don’t hesitate to reach out.
John A. Kilpatrick, Ph.D. — john@greenfieldadvisors.com
Share this:

The upside of a little recession
First, y’all miss me? It’s been a TERRIFICALLY busy summer, and I’m only beginning to catch back up on some important things, like this blog and my occasional newsletter. Mea culpa, all…
This morning, the Commerce Department reported that GDP grew at an annual rate of 2.6% in the 3rd quarter, shifting the down direction reported in the first two quarters of the year. Yes, folks, two down quarters constitutes a recession, and an up quarter marks the end. However, the apparent improvement is largely the result of fluctuations in things like international trade, and as Mark Zandi of Moody’s Analytics noted, “if you take a step back and look at GDP, it’s gone effectively nowhere over the last year… we’re kind of treading water.” Coupled with very real inflation numbers, and it’s no wonder there’s widespread concern.
I will note that I began my career in the stag-flation days of the late 1970’s. Double-digit inflation, interest rates in the teens, and flat-lined GDP were the norm. I don’t want to minimize the angst of today’s wage-earners and those just starting out on their careers, and acknowledge that the past 50 years have been hell on the working class. That said, though, our economy is generally pretty healthy and we’re in a good position to deal with the systemic underlying problems.
From a real estate investment perspective, though, recessions create opportunities. Many investments get over-leveraged in low-interest rate environments, and increasing interest rates may put before-tax-cash-flow under water. The owners may have little ability to re-capitalize, and new investors with the right amount of equity may find a bargain. Value-added deals may now be on the table, because tighter lending requirements may again call for a higher equity infusion.
Are these deals popping up yet? Not in my observation, and in fact there still seems to be a lot of dumb money chasing deals. I get an average of one cold-call per day asking if I’m interested in selling a given property. “Sure, what’s your offer?” That’s when the line goes dead, because all of these callers are reading off the same script, and all of them are bottom fishing for half-price sales from desperate sellers.
If the recession really is over, and the jury is still out on that, then sustained higher interest rates may still generate opportunistic deals for investors with cash. However, a sustained recession coupled with high interest rates will usually generate an assembly line of deals for investors with longer time horizons and staying power.


