Archive for the ‘Uncategorized’ Category
REIT Report — What do the fundamentals say?
Last week, I purposely looked at one of the smallest REIT sectors, Gaming/Leisure, with only two publicly traded REITS (VICI and GLPI) so that this week we could explore some simple tools for fundamental analysis.
VICI, as you recall, is a highly diversified gaming/leisure company with properties in various subsectors all across the US. The stock has trended downward this year and was trading today at $29.17. GLPI is a more focused gaming company that closed today at $46.38. Nonetheless, analysts generally have a favorable view of these two REITs, which begs the question: why?
To address this, I’m going to look at three different fundamental analysis methods useful for studying REITs: the AFFO multiple, the Dividend Discount Model, and the Net Asset Value. AFFO stands for “adjusted funds from operations” and basically measures the cash flow from the business operations, exclusive of cash that may come in from borrowing, asset sales, etc. AFFO gives a good measure of cash available for dividends and/or operational growth. For a given REIT, the price typically trends around a multiple of annual AFFO.
Pure dividend plays (preferred stocks, for example, and low-growth dividend stocks like utilities) can be analyzed as a discounted present value of the future dividends. If those dividends are expected to grow in perpetuity, then this growth can be factored into the equation.

In the above, P is the intrinsic price, D1 is next year’s dividend, r is the expected return on equity capital, and g is the expected perpetuity growth rate.
Finally, every REIT (and any derivative instrument, such as a mutual fund) has a determinable net asset value. For REITs this is simply the expected net operating income capitalized by the expected cap rate, minus any debt. I’ve run these models for the most recent years data, and arrived at the following:
| Price (11/14/23) | AFFO Model | Dividend Model | NAV Model | Overall Value | |
| VICI | $29.17 | $28.75 | $27.44 | $31.17 | $29.12 |
| GLPI | $46.38 | $45.71 | $44.53 | $73.73 | $54.52 |
As you can see, these two REITs are currently trading very close to their estimated intrinsic value, which suggests the markets are working fairly efficiently. What does this say about investment opportunities? I would note that most value investors look for some cushion below the intrinsic value for a buying opportunity — perhaps even a 25% to 40% discount off intrinsic value. Of course, your investment objectives may differ. I would also note that all three of these models depend on a host of assumptions about market discount rates, growth rates, and cap rates, so different intrinsic value models may produce significantly different results.
Thanks to Eli Breece of Dividenology who developed this really great REIT analysis tool. I’ll return to this again in the not too distant future.
As always, I’m not an investment advisor, and this is not a solicitation or recommendation to invest in anything. Further, I and the entities I’m involved with may have positions or interests in one or more of the securities discussed here. However, if you have any questions about this, please don’t hesitate to reach out.
John A. Kilpatrick, Ph.D., MAI
Share this:

REIT Report — Gaming and Leisure Sector
After a week’s break, we’re back this morning with the gaming and leisure sector. There are only two REITs in this group, and they’ve performed remarkably similarly over the past year and 5 years. Both have been steady performers over the recent 5-year span, but like most other REITs, disappointing in the past 12 months.

VICI Properties (VICI) is fairly diversified across the sector. They own or joint ventures 54 gaming facilities and 38 non-gaming “experiential properties”, over 500 restaurants, bars, clubs, & sportsbooks, about 500 retail outlets, and about 60,300 hotel rooms. They also have 33 acres of undeveloped land in and around Las Vegas, including land at or near “The Strip”, and 4 championship golf courses. For example, they acquired the MGM Grand/Mandalay Bay joint venture from Blackstone for about $1.3 Billion in January and have entered the “family entertainment” sector with the acquisition of 38 bowling entertainment centers, known as the “Bowlero Portfolio”, slated to close in the 4th quarter. Their properties are scattered throughout the US and they have several properties in Alberta, Canada. Among their holdings are real estate assets leased on a triple-net basis to such tenants as Caesars, Century Casinos, and Hard Rock. For the 3rd quarter of this year, they reported EPS of $0.55, compared with $0.34 in the 3rd quarter of 2022. FFO per share was $0.54, compared with $0.49 the same quarter last year. Their stock price is down 8.81% for the past 12 months, but up 33.64% over the past 5 years. Of course, this 5-year performance included the trough of the pandemic, when their stock tumbled along with other hospitality and gaming interests. Since that trough, the stock has more than doubled.
Gaming and Leisure Properties (GLPI) is much more focused on gaming. They own 61 gaming and related facilities scattered across 18 states in the US. For example, they own the Tropicana Las Vegas, Bally’s Casino in Black Hawk, CO and related properties, the DraftKings at Casino Queen in East St. Louis, the Hard Rock Casino in Rockford, IL, and the Ameristar Casino Hotel in Council Bluffs, IA. All of their attention is on gaming and related properties. For the quarter ending June 30, they reported $0.59 in EPS, compared with $0.61 for the 2nd quarter of 2022. FFO, which they do not report on a per-share basis, decreased about 4% in the 2nd quarter compared to the same quarter last year. The stock is down 8.82% over the past 12 months, but up 37.35% over the past 5 years. Much like VICI, their stock has more than doubled since the trough of the pandemic.
So that’s it for today, folks. Next week I hope to talk about some of the more general issues facing gaming, leisure, and the related hospitality field.
As always, I’m not an investment advisor, and this is not a solicitation or recommendation to invest in anything. Further, I and the entities I’m involved with may have positions or interests in one or more of the securities discussed here. However, if you have any questions about this, please don’t hesitate to reach out.
John A. Kilpatrick, Ph.D., MAI
Share this:

Are REITs Growth Stocks?
Are REIT shares “stocks” or are they “real estate”? This is a matter of no small debate in both academia and the industry, and most tests of the question surround the degree to which REIT share prices are colinear with the broader market (say, the S&P 500). My own studies suggest more real estate than stock, but with some stock features.
With that in mind, to the extent that REITs are just high-dividend growth stocks, then the intrinsic value of REIT shares should conform to normal growth market expectations. For example, if a share price deviates from its underlying intrinsic value, then that should give us a “buy” or “sell” signal. One of the more common and simple ways to measure the intrinsic value of a growth stock is via the Graham Model, developed by Columbia University professor Ben Graham and outlined in his 2006 book The Intelligent Investor. His model is fairly simple, although over the years it’s been modified a bit. He showed that the intrinsic value (V) of an “investment quality” growth stock should be a function of the most recent earnings per share (EPS), the expected growth rate of the company’s earnings (g), the price/earnings multiple for base-line growth companies (8.5), and the ratio of the long-term average of AAA corporate bond yields (4.4) to current bond yields (Y):

In recent years, investors have used a somewhat more cautious approach, assuming only 1 X g and an industry PE of 7:

To test this out, I’ve examined all of the Residential REIT shares we looked at earlier this month which reported positive earnings per share for the 2nd quarter. I’ve used the more conservative version of the model. For “g” I’ve used the annualized 5-year growth expectations of industry analysts as reported by Yahoo finance and the Moody’s seasoned AAA rated long-term bond yield as of the end of September (5.13%). The results suggest that nearly all of the REITs are presently trading above intrinsic value, and only two (CPT and EQR) are slightly below. Indeed, two of the REITs show negative intrinsic value, because analysts project negative annualized growth rates for those REITs over the next five years.
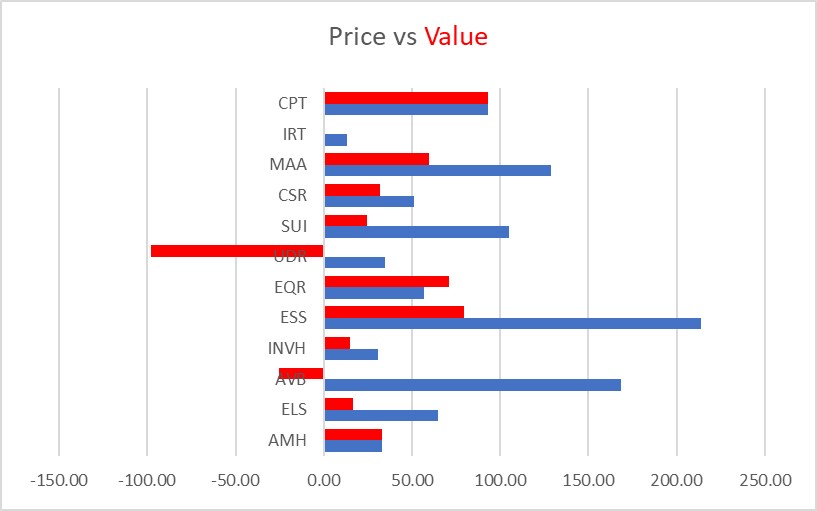
If you want to try this at home, many industry analysts will use a safety buffer, say 65% of intrinsic value, as a Buy/Sell threshold.
Some might argue that since REITs are really a dividend-paying investment rather than a pure growth play, then a model such as Gordon’s would work better, and there is some argument for that. However, Gordon’s Growth Model requires some factors that are not as easily derived from the market (e.g. – rate of return for the company in question) as well as some speculation about dividend growth rates. As a compromise, perhaps this model could be modified using Funds from Operations (FFO) rather than EPS, since the former is more closely aligned with cash available for dividend payouts. I plan to tinker with this a bit in the future, and I’ll get back to you with the results.
So that’s it for today, folks. As always, I’m not an investment advisor, and this is not a solicitation or recommendation to invest in anything. Further, I and the entities I’m involved with may have positions or interests in one or more of the securities discussed here. However, if you have any questions about this, please don’t hesitate to reach out.
John A. Kilpatrick, Ph.D., MAI
Share this:

REIT Report — Debt Levels
Over the past few weeks, I’ve reported on several REIT sectors, with a particular focus on debt levels. It may be important to put this in context. According to NAREIT, over the past four years, every equity REIT sector tracked has shown a marked decrease in leverage relative to the market value of assets. Now, part of this stems from the very real run-up in real estate asset prices both during the pandemic as well as afterwards as investors sought hedges against inflation. Nonetheless, from our own observations, most REIT managers appear to be cautious in their use of debt right now, particularly as the quality of assets to be acquired remains questionable.
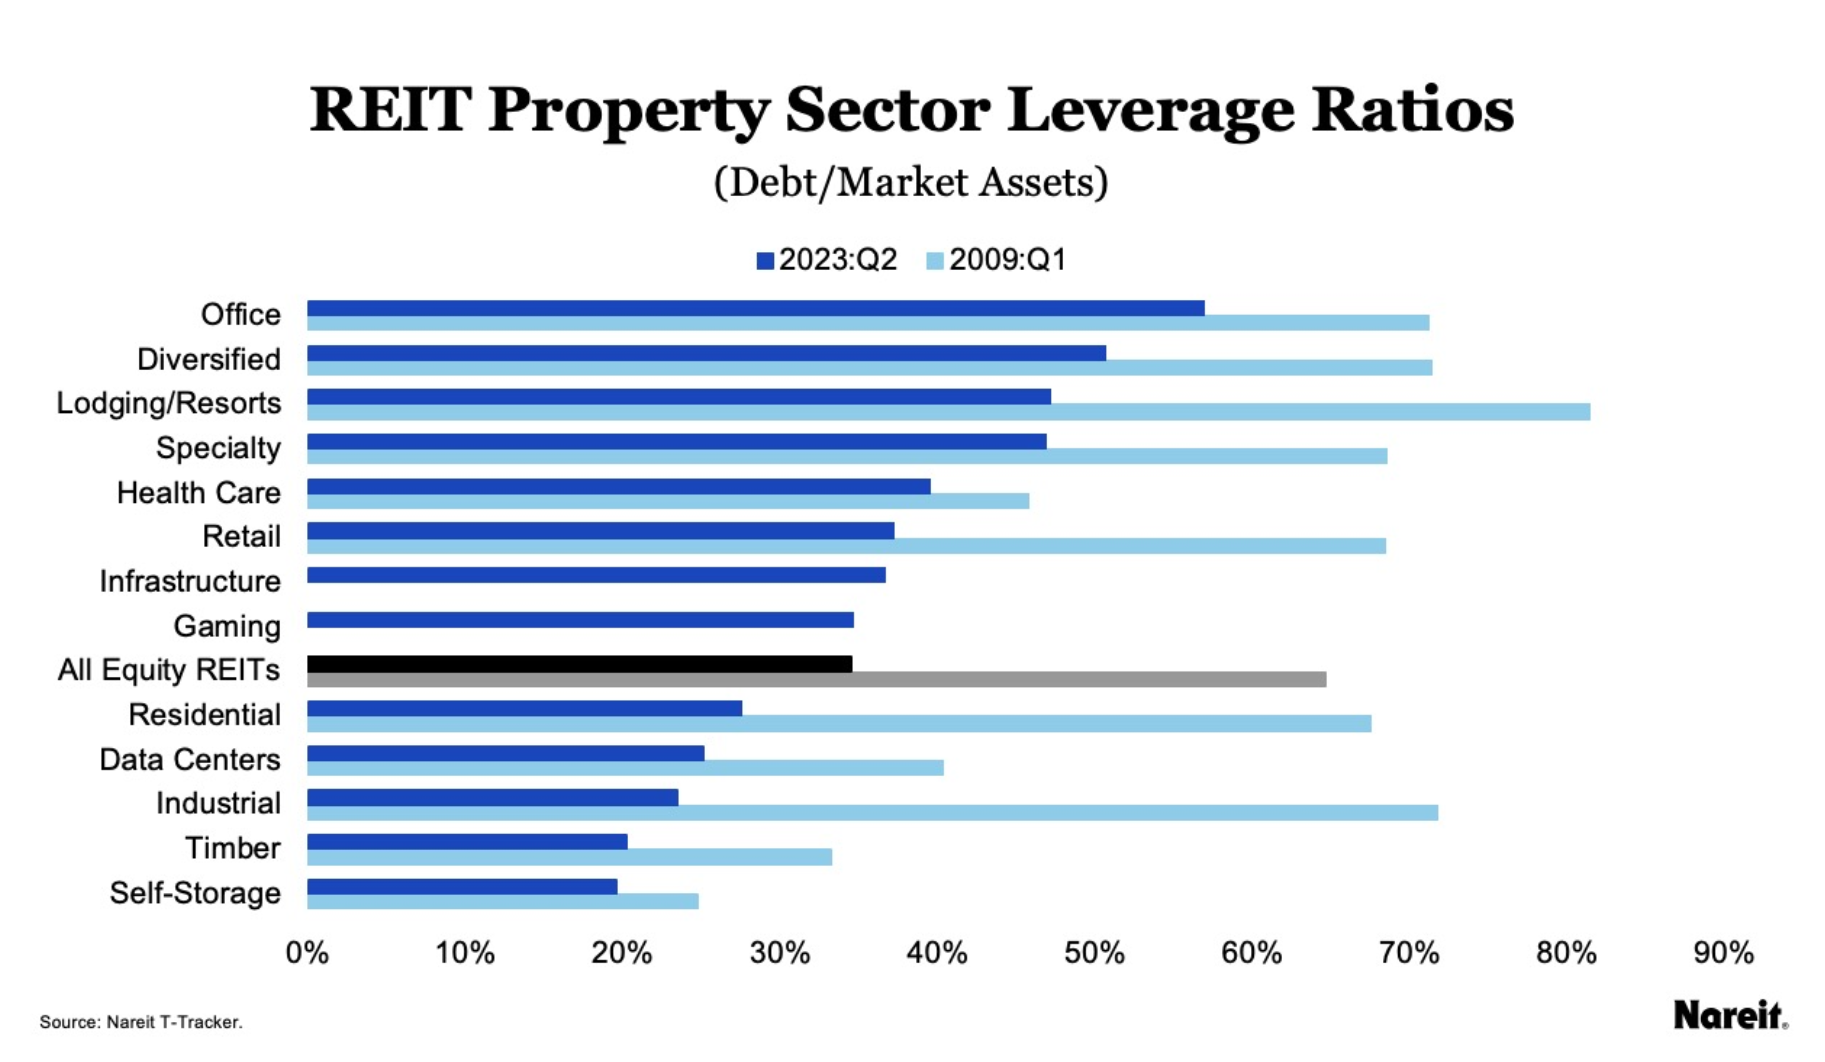
In a report last month for NAREIT, Edward F. Pierzak and Nicole Funari found that:
- Leverage ratios (debt to market) average below 35%
- Fixed-rate debt averaged about 91% of total
- Unsecured dent averaged about 79% of total
As of the 2nd quarter of this year, only the office and diversified sectors had total debt/market ratios above 50%. The authors posit that these favorable debt ratios give securitized REITs a significant advantage going forward relative to private equity holdings.
So that’s it for today, folks. As always, I’m not an investment advisor, and this is not a solicitation or recommendation to invest in anything. Further, I and the entities I’m involved with may have positions or interests in one or more of the securities discussed here. However, if you have any questions about this, please don’t hesitate to reach out.
John A. Kilpatrick, Ph.D., MAI
Share this:

REIT Report — Residential Sector
The Residential REIT sector generally spans three subsectors – apartments, single-family detached rental communities, and “lifestyle” REITs which invest in manufactured housing, RV parks, and marinas. The thee subsectors have been driven by similar forces over the past years. First, there is an organic demand for new rental housing as population growth drives household formation. The market for single family rental homes was particularly hot during the pandemic, and those REITs saw dramatic run-ups followed by a tough period failing to meet investor expectations.
The sector is also affected by the homeownership rate and housing affordability, which can increase demand for non-owner-occupied housing. Conversely, rental housing supply is impacted by the same forces that impact owner-occupied supply, such as increased building costs, increasing interest rates, and lack of space in desirable markets. Overall, rents have increased faster than inflation in most markets, but so have costs. REIT share prices performed extremely well during the pandemic, and particularly in the single-family detached rental market, and as a result there has been some negative re-bound as investors recognized that sky-high returns couldn’t continue year-after-year.
Finally, the lifestyle REITs are particularly sensitive to an aging population, who see manufactures housing (particularly in the sunbelt), RVs, and marinas as part of that slow transition into retirement.
Mostly, the sector has had a tough year, price-wise, although many of these with strong fundamental had a good run over the five-year horizon.

Veris Residential (VRE) owns or joint ventures 24 apartment complexes spanning 6,691 units with reported occupancy of 95.7% and an average asset age of 7 years. They also own several non-core properties (three office properties and four parking/retail). They sold some discontinued office/hotel properties in the first half of the year, and list some others as classified for sale. They did not report any property acquisitions during the first half of the year, but report $256 million in land held for development and $37 million in construction in progress. Debt makes up about 63% of their capital stack. EPS for the 2nd quarter of this year was a negative $0.30, compared to a positive $0.25 for the same quarter 2022. Despite a substantial 44% increase in rental income, VRE suffered from an increase in interest expenses and other financing costs. As a result, FFO declined into negative territory in the 2nd quarter of this year. Even on a 6-month basis, FFO declined about 90% from the first half of 2022 to the first half of 2023. The stock is up 53 percent over the past year, nearly all of that the result of a hostile takeover bid from the Kushner Companies back in October, 2022. The bid was rebuffed by Veris, but the market appears to have acknowledged (and thus already priced) some hidden value in the company. Interestingly, over a 5-year horizon, when most residential REITs did fairly well, Veris is actually down 20%, even including the Kushner offer.
AMH REIT (AMH), known also as “American Homes 4 Rent”, focuses on single-family rental home communities. As of the end of the 2nd quarter, AMH owned 58,693 single family properties in 21 states, including 648 properties classified as “for sale”. During the 2nd quarter, they sold 415 dwellings for net proceeds of $126.8 million (about $306,000 per property) and a gain on the sales of $62.6 million. AMH did not report any acquisitions during the first half of this year, but did report $750 million in single family properties under development. As of June 30, total real estate assets were carried at a book value of $11.5 Billion. Debt makes up about 40% of their capital stack. For the 2nd quarter of this year, net EPS was $0.27, compared to $0.16 during the same period last year. FFO grew by about 8.9% over that period. AMH is up 6.53% over the past 12 months, and up over 68% over the past 5 years, with fairly spectacular growth during the pandemic when the market for single family rentals was hot.
Equity Lifestyle Properties (ELS), One of several REITs founded by the late Sam Zell, ELS owns manufactured home communities, RV Parks, and marinas. Their manufactured home communities are age-qualified, catering to the “active adult” lifestyle, and span about 200 properties with 72,700 manufactured home sites. The RV park portfolio includes 200 parks under the Thousand Trails and Encore Resorts labels, in 30 states and British Columbia with 62,700 RV sites. They own 23 marinas, primarily in Florida (19) totaling 6,900 boat slips. In the past 18 months, ELS has acquired 7 more properties and expanded several others. EPS for the 2nd quarter of this year was $0.34, compared to $0.33 for the same quarter last year. FFO for the 2nd quarter totaled $0.66/share, compared to $0.64 the same period last year. The stock is up 4.8% over the past year and 38.7% over the past 5 years.
Avalon Bay Communities (AVB) holds direct or indirect ownership interest in 294 apartment communities in 12 states spanning 88,650 units. As of June 30, AVB had land holdings and intentions for developing an additional 43 communities spanning 14,993 units. EPS for the 2nd quarter came in at $2.59, compared to $0.99 for the 2nd quarter last year, primarily as a result of a net gain on the sales of two apartment communities totaling $187 million. For comparison, FFO totaled $2.66 per share in the 2nd quarter, compared to $2.43 per share the same quarter last year. The stock is slightly down (-0.16%) over the past 12 months, and down about a half percent over a five-year period.
Invitation Homes (INVH) invests in single family rental homes. They own 82,837 units in California, Seattle, Phoenix, Las Vegas, Dever, Florida, Atlanta, the Carolinas, Texas, Chicago, and Minneapolis. Their typical rental home is 1,870 square feet, three bedrooms, two baths. Average occupancy is 97%, and average monthly rent across the portfolio is $1.22 per square foot, ranging from a low of $0.92 in the Carolinas to a high of $1.73 in Southern California. Typical annual turnover was about 26% in the 2nd quarter, and the average home remained unoccupied for 33 days. They acquired 188 homes in the 2nd quarter and sold 361 for a gain on the sale of $46.8 million. EPS for the 2nd quarter was $0.22 compared to $0.18 for the same quarter last year. Much like AMH, the stock had an exciting period a few years ago. Over the past 12 months, the stock is down 1.17%, but gained 51.5% over the past 5 years.
Essex Property Trust (ESS) is primarily focused on west coast apartments. Nearly all of their holdings (51.572 apartments) are in 252 communities in California and the Seattle Metro market. They additionally have about 10,000 apartments in co-investments, preferred equity interests, or under development. Apartment occupancy in the 2nd quarter was in the range of 96%-97%. Same-property revenues increased 4% from 2nd quarter 2022 to 2nd quarter 2023. EPS for the 2nd quarter was $1.55, compared to $0.87 the same quarter last year. Core FFO increased to $3.77/share in the 2nd quarter from $3.68/share the same quarter last year. The stock is down 2.39% this year, and down 9.51% over the past 5 years.
Equity Residential (EQR) also known as Equity Apartments, was also founded by Sam Zell. They own or joint venture 304 apartment communities with 80,212 units. Their primary markets are Southern California (about 27% of NOI), San Francisco, Washington DC, New York, Seattle, Boston, and Denver. The average rental rate per apartment was $2,995 during the 2nd quarter, with 95.9% reported occupancy, 20.6% annual turnover, and an average annual rental rate increase of 8%. During the 2nd quarter, EQR acquired 2 new communities with 549 apartments at a purchase price of $186.6 million, or about $340,000 per apartment. During that same period, they sold 7 properties spanning about 247 units for $135.3 million ($548,000/unit) and a gain on the sales of about $100 million. Debt makes up about 43% of their capital stack. EPS for the 2nd quarter was $0.92, compared to $0.78 the same quarter last year. FFO during that period increased by 9.6%. The stock is down 5.17% this year, and down 5.38% over the past 5 years.
UDR REIT (UDR) was previously known as United Dominion Residential Communities. They own urban apartments in such upscale locales as Manhattan’s upper west side and San Francisco’s Mission Bay District. Their holdings include both apartments and retail space, and some are subject to net ground leases. As of June 30, they owned 162 properties in 13 states plus DC spanning 53,832 apartments along with an interest in 9,956 apartments through unconsolidated partnerships or joint ventures. They report same-store occupancy at 96.6%, with average apartment rent at $2,493. They did not acquire any new properties in the 1st half of this year, other than taking title to a 136-apartment home operating community in San Francisco through a foreclosure proceeding. However, they sold the retail component of a development community in Washington, DC, for gross proceeds of $14.4 million (and net gain of $100,000) and also sold four wholly owned operating communities totaling 1,328 apartment homes in various markets in a swap for a 51% interest in the newly created joint venture. UDR received $247.9 million in cash in this transaction and recorded a net gain of $325.9 million. EPS for the 2nd quarter was $1.05, compared to $0.01 for the 2nd quarter, 2022. FFO for those periods was $0.63 and $0.52, respectively. Debt makes up 54% of their capital stack. The stock is down 5.91% this year, and down 6.04% over the past five years.
Aimco REIT (AIV), also known as Apartment Investment and Management Company, operates in three business segments: development/redevelopment, operations, and other. The first segment consists of 12 properties: 3 apartment communities with 1,185 units, of which 276 were completed as of June 30, a single family rental community with 16 dwellings, a 106 room hotel, and land parcels held for development The second segment has 21 apartment communities with 5,600 units. The “other” category includes one office building and a property called St. George Villas. Debt makes up about 65% of their capital stack. EPS for the 2nd quarter 2023 was negative $0.02, compared with $1.57 the same quarter last year. It would appear that in 2022, their bottom line benefitted with a substantial recognition of lease modification income related to a termination of a lease of four properties. The stock is down 6.48% over the past year, but up 15.48% over the past 5 years. They had a very significant run over the period from early 2020 to late last year, up nearly 50% in about 30 or so months, but they’ve backed off since then due most likely to the headwinds of apartment development.
Sun Communities (SUI) is also in the manufactured home (354 communities), RV (182 RV properties), and marina (135) subsector. In the 2nd quarter, they sold two manufactured housing communities, one in Maine (155 developed sites for $6.8 million) and one in the UK (730 developed sites for $240 million). At year end, 2022, they acquired 22 properties of various types for a total of $2.2 Billion. So far in 2023, they have acquired two properties, a manufactured home property and a marina, for $107 million. EPS for the 2nd quarter was $0.72, compared to $0.61 for the same period last year. FFO for those same periods was $1.96 and $2.02, respectively. Same property NOI increased by 6.3% from the 2nd quarter 2022 to 2nd quarter 2023. Debt is about 54% of their capital stack. SUI is down 7.64% this year, but up 22.73% over the past 5 years, mostly as a result of doubling in price between early 2020 and late 2021. However, the stock ran out of steam in early 2022, and is down nearly 50% since then.
UMH Properties (UMH) invests in manufactured home communities. They own 135 such communities in 11 east-coast and mid-west states with 25,700 homesites. They also own 9,600 rental homes on about 37.4% of their sites, and occupancy in the rental homes is reported at 93.9%. They added 534 new rental homes in the first six months of this year, and intend to add 800-900 total this year. They also have an ownership interest in and operate two such communities in Florida through a joint venture. In the first half of this year, they acquired one new facility in Georgia with 118 newly developed homesites at a price of $3.7 million, of which $234,000 was land. Debt makes up about 54% of their capital stack. EPS for the 2nd quarter was negative $0.07, compared with negative $0.41 the same quarter last year. FFO during that same period rose by about 8%. The stock is down 7.89% this year, and down about 3% over the past 5 years.
Centerspace (CSR), also known as Centerspace Homes, owns 75 apartment communities with 13,479 units. Debt makes up 49% of their capital stack, but notably 49 of their apartment communities are unincumbered by mortgages, and they also have in excess of $200 million undrawn on a credit line. Centerspece did not acquire any new properties in the first half of 2023, and disposed of 9 properties totaling 1,567 units during that time period for an aggregate sales price of $144.3 million and an aggregate gain on the sale of $60 million. Their two largest markets were Denver and Minneapolis, each of which has more than 10% of their holdings. EPS for the 2nd quarter of this year as a negative $0.23, compared with a negative $0.30 during the same period last year. Core FFO per share for the same periods was $1.28 and $1.12, respectively. Centerspace is down about 10.12% over the past 12 months, but up about 8.58% over the five year horizon, mainly due to a big price bubble in 2021.
MAA REIT (MAA) focuses on luxury apartment rentals. Specifically, they own and operate 290 communities (not including those under development) in the southeast, southwest, and mid-Atlantic regions plus one unconsolidated unit in a joint venture with a total of about 102,000 apartments. About 34 of these communities also have retail components of various kinds. As of June 30, they had 6 communities under development totaling 2,310 units. Total expected cost for the new units will be $735 million, or about $318,000 per apartment. EPS for the 2nd quarter was $1.24, compared to $1.82 for the same quarter in 2022. The difference appears to come from gains on the sale of some properties in 2022. Quarterly same store rental revenues increased from 2022 to 2023 by about 8%, and FFO grew by about 14%. MAA is down 10.27% over the past 12 months, but gained 37.74% over the five year horizon.
Independence Realty Trust (IRT) owns and operates in “non-gateway” markets. They have 119 multifamily properties with 35,249 units, generally in the sunbelt. As of June 30, they held one property in Chicago classified as “for sale” with 374 units which they expect to sell in the 2nd half of this year, and they also sold one property in Indiana for $37 million, realizing a gain of $985,000. Debt is about 43% of their capital stack. EPS for the 2nd quarter this year was $0.05, up from negative $0.03 the same quarter last year. FFO per share for the same periods was $0.28 and $0.26, respectively. Same store occupancy declined a bit over the period, from 94.1% to 93.1%, but average effective monthly rent rose by 8.9%. Their stock is down 10.91% over the past 12 months, but up 43.3% over the 5 year horizon.
Apartment Income REIT (AIRC), also known as AIR Communities, operates 73 apartment communities with 25,739 units, in 10 states and DC. They also own one land parcel. EPS for the 2nd quarter this year was negative $0.01, compared to $1.26 for the same period last year. FFO/share for these periods was $0.58 and $0.66, respectively. Indeed, same-store rents increased by 8.9% over this period. The principal difference appears to be gains/losses on dispositions of assets. During the 2nd quarter, they sold 4 apartment communities with 718 units for a gain on the sale of $175,6 million. In contrast, during the first half of 2022, they sold 12 communities with 2,050 units, for a gain on the sale of $588 million. Debt amounts to about 65% of their capital stack. The stock is down 14.75% over the past 12 months, and down 20.82% ever since its December 15, 2020 spin-out from Apartment Investment and Management Company.
Camden Property Trust (CPT) owns 177 multifamily properties totaling 60,514 units, of which 5 were under development totaling 1,553 units. The largest number of their properties is in Texas, and other top markets include DC, Atlanta, Phoenix, and various parts of Florida. They also own land held for future development. Debt makes up 46% of their capital stack. EPS for the 2nd quarter 2023 came to $0.84, compared to $4.59 for the same period last year. The difference appears to stem from a 2022 gain on the acquisition of unconsolidated joint venture interests. By comparison, FFO for those periods increased by 7%. The stock is down 15.23% for the past year, but up 7.35% over the 5 year time frame, in no small part due to its run-up in the 2020-2021 period when its stock price nearly doubled.
ELME Communities (ELME) owns 8,900 apartments primarily in the DC area and the sunbelt and about 300,000 square feet of commercial space in the DC area. About 92% of their revenues come from real estate rents. They report same-store occupancies at 95.6%, about the same as a year ago. Debt constitutes 33% of their capital stack. EPS for the 2nd quarter was negative $0.03, compared to negative $0.10 for the same quarter last year. FFO was positive and increased 24% over that same period. It’s stock is down 17.6% over the past 12 months, and down 50.9% over the 5-year timeframe, with a nearly steady decline over that period.
BSR Real Estate Investment Trust (HOM.U) is a Canadian REIT which trades in the Toronto exchange. They own 31 multi-family properties consisting of 8,666 total units, 85% of which are in Texas, 11% in Oklahoma, and 4% in Arkansas. FFO/Unit for the 2nd quarter 2023 was US$0.23, an increase of 9.5% over 2022. Weighted average apartment rents increased by 6.3%, and same community revenues increased by 8.5%. BSR had no acquisitions or disposals from 2022 to 2023. Their weighted average occupancy rate is 95.3%, and they report a 56% retention rate. BSR stock is down 17.72% over the past 12 months, but up 31.74% over the 5-year horizon.
Nexpoint Residential Trust (NXRT) owns and operates 40 properties totaling 15,127 units acquired since 2014. They report a 93.9% occupancy and a weighted average monthly rent of $1,497. There were no acquisitions or sales during the first half of this year. Debt makes up 78% of their capital stack. EPS for 2nd quarter 2023 was negative $0.15, compared to negative $0.30 for the same period last year. However, same-store rents increased by 7.6% over that period, but core FFO declined by 3.2% from 2022 to 2023. The stock is down 21.93% over the past 12 months, and down 6.44% over the five-year period.
Clipper Realty (CLPR) owns nine properties, all in New York City. Eight of these are either residential or a combination of residential and commercial, and one is a development site. The only acquisition over the past two years was additional land for the development site. Debt makes up 98% of their capital stack. EPS for the 2nd quarter 2023 was negative $0.10, compared with negative $0.08 for the same period last year. FFO over that same period increased by 5.1%. CLPR shares are down 27.06% over the past 12 months, and down 60.42% over the past 5 years.
So that’s it for today, folks. As always, I’m not an investment advisor, and this is not a solicitation or recommendation to invest in anything. Further, I and the entities I’m involved with may have positions or interests in one or more of the securities discussed here. However, if you have any questions about this, please don’t hesitate to reach out.
John A. Kilpatrick, Ph.D., MAI
Share this:

REIT Report — Health Care Roundup
This is the third in a three-part series on the Health Care REIT sector. Two weeks ago I reviewed a somewhat rosy piece from NAREIT on the macro issues facing the sector. Last week, I looked at the one-year stock performance for all of the publicly traded shares in this sector (and the 5-year performance on many of them). Readers may remember that returns on those shares were all over the map, and the winners generally had something special or unique, such as a takeover or merger.

Today, I want to look at these shares at a micro level, diving into the 2nd quarter SEC filings and reporting, at least anecdotally, on what they’re telling Federal regulators about their sectors. Since I reported FFO, EPS, and stock prices last week, I won’t repeat myself on those topics today. It is difficult to draw industry-wide comparisons, since for the most part these companies are scattered across the various subsectors of Health Care. However, certain generalizations do emerge:
- Higher interest rates have an impact across most of the REITs in this sector, although a couple of them have benefitted from interest rate hedges, from being net-lenders in their subsector, or from having strong cash positions.
- Many of these REITs suffer from impairment issues, either directly or as a result of partnerships with troubled operators. Assisted living facilities seem to be the worst hit.
- Development and acquisition activity is down from 2022, perhaps due to interest rate or credit squeezes, but perhaps more so from lots of money/credit chasing too few choice properties. Redevelopment of existing facilities seems to be more common.
- While most of these REIT stocks have suffered in the past year, five-year results would suggest that the market has not responded well to macro-forces which should be driving the industry. While there is little doubt of increasing long-term demand for health care assets, one has to wonder if the market doesn’t think the industry is over-supplied?
I would continue to note that the senior living portion of this sector has been particularly adversely affected by the continuing impact of the COVID-19 pandemic as well as the current economic and market conditions. These conditions continue to have a significant negative impact on results of operations, financial positions, and cash flows. Although there have signs of recovery and increased demand when compared to the low levels during the COVID-19 pandemic, the recovery of senior housing operating portfolios has been slower than previously anticipated. As such, REITs report that they cannot be sure when or if the senior housing business will return to historic pre-pandemic levels. Added to this is the burden of rapidly increasing labor costs and labor shortages. I would note also that there are very few pure-plays on senior care, as many of the Health Care REITs have diversified across property types within the sector (medical offices, clinics, laboratories, etc.).
For example, as I noted last week, Diversified Health Care Trust (DHC) owns medical office buildings (36% of their portfolio) as well as senior living communities (46%), life sciences (13%) wellness centers (4%) and skilled nursing (1%). They own about 27,000 senior living units and about 100 other buildings with about 500 tenants spanning 36 states and DC, with the largest proportion of holdings in the sunbelt, and particularly California, Texas, and Florida In their second quarter filings, DHC reported substantial doubts as to its ability to continue as a going concern, and thus has entered into an agreement to merge with Office Properties Income Trust (OPI) which is expected to close during the 3rd quarter.
Also, as I noted last week, Welltower (WELL) stock is up 24.16% year-over-year and up about 29% over the past 5 years. They are also diversified, in many of the same segments as DHC. They operate through a series of strategic partnerships, and derive no more than 8% of their NOI from any one “relationship” (as they call them). They acknowledge some exposure to interest rate fluctuations, and debt makes up about 45% of their capital stack. However, they appear to be aggressively hedging in that arena, and recognize it as a very real risk.
Omega Health Care Investors (OHI) is primarily in the skilled nursing care field, with 893 properties in the forty-two of the US states and the UK with a total of 88,322 beds, the largest concentration being in Florida (11.4%). As reported last week, their stock is up 10.83% year-over-year, but all of that return has occurred in the most recent 6 months. Over the past 5 years, the stock has cycled a good bit, but today is basically back where it was 5 years ago. Over the first six months of 2023, Omega has invested some $27.9 million in new construction and capital improvements but sold 12 facilities (11 nursing facilities and one office building) for $62.3 million. During that same period, they recorded impairments on six facilities necessitating write-downs of about $60.1 million. Of this total, nearly all ($57.5 million) was for facilities closed during the year for which the carrying value exceeded the estimated fair value, and $2.6 million related to two facilities held for sale. In addition, during this period, four partner-operators were placed on a “cash basis” for revenue recognition, as nearly all contractual lease payments due from these operators were not deemed probable. This brought the total number of operators on a cash basis to 18, constituting 25.8% of total revenues excluding the impact of the write offs. Also, nine operators were allowed to defer $33.6 million of contractual rent and interest. Two of these operators were allowed to enter into restructuring agreements.
Caretrust REIT (CTRE) invests in skilled nursing facilities (72% of their portfolio, 148 properties), assisted and independent living facilities (15%, 32 properties) and campuses with a mix of services (12%, 25 properties). They have 205 properties in 25 states with 22,311 beds total. Of the total properties, 28% are in California and 23% in Texas. As of the end of the 2nd quarter, 36% of revenues came from one partner (Ensign) and 16% from another (Priority Management Group). As noted last week, EPS for the 2nd quarter was a negative $0.01, compared with $0.21 the same quarter last year. Much of this can be attributed to a recognition of certain impaired real estate assets, attributed to post-pandemic inability of partners to fully meet obligations on certain facilities. Specifically, in the first six months of 2023, Caretrust recognized an impairment charge of $23.3 million, all related to 15 properties which were held for sale, and recorded an expected credit loss of $4.6 million on two loans receivable that were put on a cash basis. Caretrust sold 4 properties during this period for a net gain on sale of $1.958 million, and during that same period acquired 12 properties, including 7 skilled nursing facilities, 4 assisted living facilities, and 1 multi-service campus, with a total of 1,280 beds and at a total purchase price of $172.4 million.
Sabra Health Care REIT (SBRA) invests in skilled nursing (55.7% of their portfolio), Senior Housing both managed (15.4%) and leased (10.5%), Behavioral Health (13.6%), Specialty Hospital (4%) and other health care properties (0.8%). They have 392 properties through 67 partners in the U.S., British Columbia, and Alberta. Other than the 61 managed Senior Housing communities, all of their properties are triple-net leased to partners. Debt in the amount of about $2.58 Billion constitutes about 47% of Sabra’s capital stack. In the first 6 months of this year, they purchased two new senior housing properties, one managed and one leased, at a total consideration of $51.5 million. There were no transitions of partner-properties to cash-basis during that period, but in the 2nd half of 2022, Sabra did conclude that their leases with North American Health Care, Inc. had to be written-off to the tune of $15.6 million, and in the first six months of this year, those facilities were transitioned to other partners. Also, during the first six months of this year, one skilled nursing/transitional care facility was recognized as impaired, resulting in a write-off of $7.1 million, and that facility was subsequently sold.
Global Medical REIT (GMRE) is a net-lease medical office REIT which acquires healthcare facilities and leases those to physicians groups and healthcare systems. They own 186 buildings with an aggregate of 4.8 million leasable square feet. Nearly all of their income is from facility rentals. While debt makes up about 51% of their capital stack, Global substantially reduced this down from 53% during the first six months of the year. The company mainly finances through a $900 million credit facility with JPMorgan Chase, of which about $568 million was used as of June 30. As of June 30, GMRE had commitments and obligations of about $29.6 million for capital improvements. In 2022, the company reported approximately $157 million in acquisitions (14 properties) in 2022 and one disposition of $15.9 million during that same period. For the first six months of 2023, the company reported only one acquisition at $6.7 million, and two dispositions, one of a 4-building portfolio for $66 million resulting in a gain on the sale of $12.8 million, and one of a single building for $4.4 million resulting in a gain on the sale of $0.5 million.
Ventas (VTR) owns 1,392 properties spanning 24 million square feet including senior living (825 properties), life sciences, research & innovation properties (46), medical & outpatient offices (414), skilled nursing (51) and other health care real estate (56) in the US, Canada, and the UK. Liabilities make up 59% of their capital stack. During the first half of this year, they sold 6 senior housing communities, three of which were vacant, five outpatient medical buildings, one research center, and 3 triple-net lease properties (two of which were vacant) for $64.4 million, recognizing a gain on the sale of $11.6 million. As of June 30, 2 other properties were held for sale totaling about $18 million in book value. During this period, the company recognized $19.2 million in impairments on assets.
Community Health Care Trust (CHCT) owns 184 properties in 34 states totaling about 4 million square feet, including medical office buildings (85 properties), inpatient rehab facilities (7), specialty centers (37), physician clinics 30), acute in-patent behavioral facilities (5), hospitals and surgical centers (10), behavior specialty facilities (9) and one long-term care hospital. As of the end of the 2nd quarter, 91.7% of properties were leased with a weighted average lease term of 7.1 years. The largest number of their properties is in Ohio (25), followed by Florida (22), Texas (16), Illinois (16), and Pennsylvania (13). Their largest single tenant by gross investment is Lifepoint Health, with 5 properties constituting an aggregate investment of $82.3 million, and their largest tenant by number of properties is GenesisCare with 9 properties and an aggregate investment of $31 million. Their debt load is only about 44% of their total capital stack. In the first half of this year, CHCT was impacted by the bankruptcy of GenesisCare, in which the Court approved the debtors request to reject certain unexpired real property leases including one of 11,000 square feet with CHCT. Also, GenesisCare was the sole tenant in seven of CHCT’s properties, and a partial tenant in two others, representing 3.1% of CHCT’s total gross real estate, or 119,000 square feet. However, other than the rejected lease, GenesisCare has continued to meet its lease obligations. During the first half of the year, CHCT acquired ten medical office buildings totaling 237.4 million square feet and one vacant land parcel. The total purchase price was about $39 million.
National Health Investors (NHI) specializes in sale-leasebacks, joint-ventures, mortgage and mezzanine financing of senior housing and other medical properties. Most of their holdings are in a portfolio of investments in 163 health care properties located in 31 states and triple-net leased to 25 operators. That portfolio includes 97 senior housing communities, 65 skilled nursing facilities, and one hospital. They also have two ventures which directly own 15 independent living facilities in 8 states totaling 1,734 units. Debt makes up about half of their capital stack. During the first half of this year, they acquired 3 assisted living facilities for about $54.7 million, and disposed of 8 properties for $49.1 million (and a gain on the sale of $12.4 million). Three of the properties disposed were considered impaired at the time of sale. Also as of June 30, the company held 5 assets for sale at a net value of $13 million. The company leases 39 facilities to Bickford, and in 2022, converted those leases to cash-basis as a result of information from Bickford on their financial condition. As a result, NHI wrote-off $18.1 in rents receivable and $7.1 in lease incentives. As of June 20, Bickford’s outstanding pandemic-related deferrals were $19.8 million. In addition, two other operators were put on cash-basis in 2022, and rental income from those two operators totaled $6.5 million for the first half of this year.
LTC Properties (LTC) invests in seniors housing and health care primarily through sale-leasebacks, mortgage financings, joint-ventures, construction financing, and structured finance (preferred, bridge, mezzanine, and tranche lending). Their current portfolio of 148 properties includes assisted living (57.5%, with 97 properties), skilled nursing (41.6%, 50 properties), and 1 other property (0.9%). They have 5,570 assisted living beds and 6,349 skilled nursing beds. Income, however, comes from rentals and interest. As such, increasing interest rates have impacted their bottom line in a number of ways. First, they acquired 11 assisted living and memory communities during the first quarter of 2023, and 3 skilled nursing facilities during the third quarter of 2022, and higher interest rates impacted the financing of receivables. They had higher interest income on mortgage loans made, but lower interest income resulting from the payoff of two mezzanine loans. Conversely, LTC had higher interest expenses on their revolving credit line as well as $75 million in newly issued senior notes. Finally, LTC recorded $12.1 million as an impairment loss on two assisted living communities in negotiation for potential sale. One of those communities is non-revenue generating, and the other produces “minimal rent”.
Physicians Realty Trust (DOC) owns 227 medical office buildings in 32 states, with approximately 15.6 million leasable square feet, leased to physicians, hospitals, and health delivery systems. As of the 2nd quarter, they reported 95% occupancy, and 91% of the leasable square footage was either on a hospital campus or strategically affiliated with a health care system. During the first six months of this year, DOC acquired $40.5 million in new assets and sold one outpatient medical center for $2.6 million. Debt makes up about 43% of DOC’s capital stack, of which about $393 million is from a credit facility (17% of total debt) and $1.45 Billion (63% of total debt) in notes payable. As a result interest expenses were up 19.7% during the 2nd quarter 2023 compared to the same period last year, hedged partially by interest rate swaps. As of the end of the 2nd quarter, DOC was sitting on about $245.7 million in cash and $1.0 Billion of near-term availability on their unsecured credit facility.
Healthpeak Properties (PEAK) invests in lab campuses (3, in San Francisco, Boston, and San Diego totaling 146 properties), outpatient medical usually co-located on hospital campuses (295 properties), continuing care retirement communities (15) and other properties (19). Lab properties and outpatient medical both report a same store occupancy rate of 97.4%, while for the continuing care retirement communities that is 83.4%. PEAK’s debt makes up about 54% of its capital stack, of which the majority is in senior unsecured notes. PEAK acquired two new properties in the first half of 2023, a lab land parcel for $9 million and the remaining 80% interest in an outpatient medical building for $4 million. PEAK also has commitments of $188 million for development and redevelopment projects. Also in the first half of this year, PEAK disposed of two lab buildings which had previously been classified as “for sale” for $113 million and two medical buildings for $32 million. The combined gain on sale of these properties was $81 million. During the first quarter, PEAK wrote off $9 million from four in-place operating leases with Sorrento Therapeutics which had commenced voluntary reorganization.
Healthcare Realty Trust (HR) owns 680 outpatient medical facilities spanning 39.8 million square feet in 35 states. The majority of their properties on the campus of or adjacent to an established health care system, and they report an average of 87.4% occupancy, with 89% in same-store properties. Debt constitutes about 45% of their capital stack, of which nearly all is in Notes and Bonds Payable. In the first six months of this year, HR disposed of 8 properties totaling 492,000 square feet for a total sale price of $222 million. However, due to a significant impairment in one of these properties, the net gain was a negative $13.3 million. As of June 30, the company held three properties for sale totaling a depreciated value of $151,000 (including $3.6 million in impairment charges). Liabilities associated with these three assets totals $222,000, and thus the properties may likely be sold at a loss. HR did not report any acquisitions in the first half of the year, but incurred $49 million in expenses toward development and redevelopment of existing properties.
Strawberry Fields REIT (STRW) partners with nine skilled nursing facility operators with a total of 79 properties and 10,189 skilled nursing beds, 63 long-term acute care beds, and 99 assisted living beds in Arkansas, Illinois, Indiana, Kentucky, Michigan, Ohio, Oklahoma, Tennessee and Texas. Debt makes up over 90% of their capital stack. As such, they have a significant exposure to interest rate risk. For example, in the first quarter of 2023, interest expenses increased by 16.7% over the same quarter in 2022, primarily due to an increase in the floating rate on the commercial bank loan facility as well as additional charges on 2023 bond issuances.
Medical Properties Trust (MPW) is the 2nd largest non-governmental owner of hospitals in the world. Their portfolio of 44 properties spans 10 countries. They have about 44,000 licensed beds, including general acute care (197 facilities), behavioral (70), inpatient rehab (114), and long-term acute care (20) and freestanding ER/urgent care (43). They invest in both sale-leasebacks as well as direct investing. Debt constitutes about 57% of their capital stack. As such, in the 2nd quarter of this year, Acquisitions in the first half of 2023 totaled $212 million, down from $946 million during the first half of 2022. In addition, as of June 30, MPW had development commitments on six properties (3 in Spain, 2 in Texas, one in South Carolina) totaling $358 million. MPW disposed of $12 million in property, recording a net gain of $6 million. Interest rate expenses in the 2nd quarter were 19% above the same quarter in 2022 primarily as a result of increased borrowings on their revolver and higher interest rates on their credit facility.
As always, I’m not an investment advisor, and this is not a solicitation or recommendation to invest in anything. Further, I and the entities I’m involved with may have positions or interests in one or more of the securities discussed here. However, if you have any questions about this, please don’t hesitate to reach out.
John A. Kilpatrick, Ph.D., MAI
Share this:

REIT Report — Health Care Shares
This is the second in a 3-part series I’m doing on the Health Care REIT sector. Last week, I reviewed a recent article on this sector which looked at the broader macro-forces affecting the industry. This week is my regular REIT sector 1-year report, and next week I’m going to dive a bit into the recent SEC filings from some of these REITs to discuss specific issues these REITs and the broader industry are facing.
The Health Care sector includes several different property types, including senior living (including assisted living, memory care, and congregate independent living), life sciences, medical offices, and even some specialty niches. The senior living industry is a large portion of this sector and has been adversely affected by the continuing impact of the COVID-19 pandemic as well as the current economic and market conditions. These conditions continue to have a significant negative impact on results of operations, financial position and cash flows. Although there have signs of recovery and increased demand when compared to the low levels during the COVID-19 pandemic, the recovery of senior housing operating portfolios has been slower than previously anticipated. As such, REITs report that they cannot be sure when or if the senior housing business will return to historic pre-pandemic levels. Added to this is the burden of rapidly increasing labor costs and labor shortages.

Diversified Health Care Trust (DHC) owns medical office buildings (36% of their portfolio) as well as a senior living communities (46%), life sciences (13%) wellness centers (4%) and skilled nursing (1%). They own about 27,000 senior living units and about 100 other buildings with about 500 tenants spanning 36 states and DC, with the largest proportion of holdings in the sunbelt, and particularly California, Texas, and Florida. Substantially all NOI comes from private pay properties. The medical offices, life sciences laboratories, and other medical related facilities appear similar to regular commercial office buildings but are engineered with plumbing, electrical, lighting, waste disposal, ventilation, and mechanical systems to support the healthcare field. For the 2nd quarter of this year, they reported negative $0.30 earnings per share (EPS), compared with negative $0.46 the same quarter last year. Funds from Operations (FFO) for the 2nd quarter was $0.01 per share, the same as 2nd quarter 2022. As a result of the post-pandemic challenges, DHC reports substantial doubts as to its ability to continue as a going concern. DHC has entered into an agreement to merge with Office Properties Income Trust (OPI) which is expected to close during the 3rd quarter. As a result, their 1-year stock gain of 95.65% is somewhat misleading. A better picture is told by their 5-year performance, which was down 86%.
Welltower (WELL) focuses on senior housing, post-acute care, and outpatient medical (medical offices). They operate through local partners, such as Balfour, Brandywine, and StoryPoint. Currently they have 1,778 properties in their portfolio, consisting of 852 senior housing properties, 568 medical offices (rented at triple-net) and 358 outpatient medical facilities. The largest number of their properties are in California (11% as of the end of the 2nd quarter), the UK (8%), Texas (7%), Canada (5%), and Pennsylvania (5%). None of their partner entities provide more than 8% of their NOI, the largest two being Integra Healthcare and Sunrise Senior Living. For the 2nd quarter of this year, their EPS stood at $0.20, the same as last year, and FFO/share was $0.93, slightly up from $0.90 last year. As such, their stock is up 24.16% year-over-year. WELL is up about 29% over the past 5 years.
Omega Health Care Investors (OHI) is primarily in the skilled nursing care field, with 893 properties in the forty-two of the US states and the UK with a total of 88,322 beds. The largest concentration of properties is in Florida (11.4%) followed by Texas (10.2%), Indiana (6.6%) and the UK (6.1%). EPS for the 2nd quarter was $0.25, compared with $0.38 for the same quarter last year. Omega contracts with 66 “operators” who lease the facilities from OHI. Indeed, nearly all of OHI’s revenues are from rental and interest income. These operators in turn were impacted by the pandemic via reduced revenues, lower occupancy, increased expenses, and uncertainties regarding reimbursement levels and regulatory support. Their stock is up 10.83% year-over-year, and all of that return has occurred in the most recent 6 months. Over the past 5 years, the stock has cycled a good bit, but today is basically back where it was 5 years ago.
Caretrust REIT (CTRE) invests in skilled nursing facilities (72% of their portfolio, 148 properties), assisted and independent living facilities (15%, 32 properties) and campuses with a mix of services (12%, 25 properties). They have 205 properties in 25 states with 22,311 beds total. Of the total properties, 28% are in California and 23% in Texas. As of the end of the 2nd quarter, 36% of revenues came from one partner (Ensign) and 16% from another (Priority Management Group). EPS for the 2nd quarter was a negative $0.01, compared with $0.21 the same quarter last year. Much of this can be attributed to a recognition of certain impaired real estate assets, attributed to post-pandemic inability of partners to fully meet obligations on certain facilities. Their stock is up 7.36% year-over-year, and aside from the big dip—and-bounce that nearly all REITs experienced during the early days of the pandemic, their stock has been relatively flat over the last 5 years.
Sabra Health Care REIT (SBRA) invests in skilled nursing (55.7% of their portfolio), Senior Housing both managed (15.4%) and leased (10.5%), Behavioral Health (13.6%), Specialty Hospital (4%) and other health care properties (0.8%). They have 392 properties through 67 partners in the U.S., British Columbia, and Alberta. Other than the 61 managed Senior Housing communities, all of their properties are triple-net leased to partners. For the 2nd quarter, EPS was $0.09, up from $0.07 the same quarter last year. FFO was $0.32 per share, down from $0.36 the same quarter last year. While their stock is up 4.26% year-over-year, it has been on a steady downward trend for the past 5 years, down about 40% over that period.
Global Medical REIT (GMRE) is a net-lease medical office REIT which acquires healthcare facilities and leases those to physicians groups and healthcare systems. They own 186 buildings with an aggregate of 4.8 million leasable square feet. Nearly all of their income is from facility rentals. EPS for the 2nd quarter was $0.18, up from $0.03 the same quarter last year, and FFO/share for the second quarter was $0.21, down from $0.24 the same quarter last year. The stock has been nearly flat for the past year, and despite some price swings, the stock is basically in the same place it was 5 years ago.
Ventas (VTR) owns 1,392 properties spanning 24 million square feet including senior living (825 properties), life sciences, research & innovation properties (46), medical & outpatient offices (414), skilled nursing (51) and other health care real estate (56) in the US, Canada, and the UK. Same store NOI for senior housing is reported at 81.3%, while for outpatient medical and research facilities it is 91.7%. EPS for the 2nd quarter was $0.26, up from negative $0.10 the same quarter last year. FFO for that same period, while not reported on a per-share basis, increased about 10.5%, and NOI was up by 7.8%. Ventas stock has been basically flat for the last year, but down about 20% over the past 5 years.
Community Health Care Trust (CHCT) owns 184 properties in 34 states totaling about 4 million square feet, including medical office buildings (85 properties), inpatient rehab facilities (7), specialty centers (37), physician clinics 30), acute in-patent behavioral facilities (5), hospitals and surgical centers (10), behavior specialty facilities (9) and one long-term care hospital. As of the end of the 2nd quarter, 91.7% of properties were leased with a weighted average lease term of 7.1 years. The largest number of their properties is in Ohio (25), followed by Florida (22), Texas (16), Illinois (16), and Pennsylvania (13). Their largest single tenant by gross investment is Lifepoint Health, with 5 properties constituting an aggregate investment of $82.3 million, and their largest tenant by number of properties is GenesisCare with 9 properties and an aggregate investment of $31 million. For the 2nd quarter, EPS was $0.24, compared with $0.21 the same quarter last year. FFO per share for the 2nd quarter was $0.62, compared with $0.57 the same quarter last year. Community Health shares are down 8.71% over the past year, but basically flat over the past 5 years.
National Health Investors (NHI) specializes in sale-leasebacks, joint-ventures, mortgage and mezzanine financing of senior housing and other medical properties. Most of their holdings are in a portfolio of investments in 163 health care properties located in 31 states and triple-net leased to 25 operators. That portfolio includes 97 senior housing communities, 65 skilled nursing facilities, and one hospital. They also have two ventures which directly own 15 independent living facilities in 8 states totaling 1,734 units. EPS for the 2nd quarter was $0.92, compared to $0.47 the same quarter 2022. FFO/share was $1.06, compared with $1.26 the same period last year. NHI shares are down 13.27% from this time last year, and down about 32% over the past 5 years.
LTC Properties (LTC) invests in seniors housing and health care primarily through sale-leasebacks, mortgage financings, joint-ventures, construction financing, and structured finance (preferred, bridge, mezzanine, and tranche lending). Their current portfolio of 148 properties includes assisted living (57.5%, with 97 properties), skilled nursing (41.6%, 50 properties), and 1 other property (0.9%). They have 5,570 assisted living beds and 6,349 skilled nursing beds. Income, however, comes from rentals and interest. EPS for the 2nd quarter was $0.57, the same as last year, and quarterly FFO, while not reported on a per-share basis, was up 4.5% year-over-year. LTC shares are down 18.41% over the past year, and down about 29% over the past 5 years.
Physicians Realty Trust (DOC) owns 227 medical office buildings in 32 states, with approximately 15.6 million leasable square feet, leased to physicians, hospitals, and health delivery systems. As of the 2nd quarter, they reported 95% occupancy, and 91% of the leasable square footage was either on a hospital campus or strategically affiliated with a health care system. EPS for the 2nd quarter was $0.23, the same as the 2nd quarter 2022, and FFO/share was $0.25, compared to $0.27 for the 2nd quarter 2022. DOC is down about 20.36% over the past year, and about 27% over the past 5 years.
Healthpeak Properties (PEAK) invests in lab campuses (3, in San Francisco, Boston, and San Diego totaling 146 properties), outpatient medical usually co-located on hospital campuses (295 properties), continuing care retirement communities (15) and other properties (19). Lab properties and outpatient medical both report a same store occupancy rate of 97.4%, while for the continuing care retirement communities that is 83.4%. EPS for the 2nd quarter was $0.09, compared with $0.13 the same quarter last year, and FFO, while not reported on a per-share basis, increased 12.9% from the 2nd quarter 2022 to the 2nd quarter 2023. PEAK is down 22.45% over the same time last year, and down 28% over the past 5 years.
Healthcare Realty Trust (HR) owns 680 outpatient medical facilities spanning 39.8 million square feet in 35 states. The majority of their properties on the campus of or adjacent to an established health care system, and they report an average of 87.4% occupancy, with 89% in same-store properties. The 2nd quarter EPS was negative $0.22, compared with $0.04 the 2nd quarter of 2022. FFO/share for the 2nd quarter was $0.39, compared with $0.45 the same period last year. Notably, the number of shares outstanding increased from 149.7 million to 378.9 million due to a reverse merger dated July 20, 2022 by and among Healthcare Realty Trust, Healthcare Trust of America, and related holding companies. HR stock is down 28.98% over the past year, with nearly all of that decline happening over the past two months. Over the past 5 years, HR shares are down 47%.
Strawberry Fields REIT (STRW) partners with nine skilled nursing facility operators with a total of 79 properties and 10,189 skilled nursing beds, 63 long-term acute care beds, and 99 assisted living beds in Arkansas, Illinois, Indiana, Kentucky, Michigan, Ohio, Oklahoma, Tennessee and Texas. EPS for the 2nd quarter 2023 was $0.19, compared to zero the same quarter 2022. While FFO is not reported on a per-share basis, it increased by 6.5% from the 2nd quarter 2022 to the 2nd quarter 2023. STRW is down 37% over the past year The stock only began trading in September of last year.
Medical Properties Trust (MPW) is the 2nd largest non-governmental owner of hospitals in the world. Their portfolio of 44 properties spans 10 countries, including the US (61%), the UK (22.4%), Germany (3.9%), Switzerland (3.5%), Australia (1.6%), Spain (1.2%) and others (6.4%). They have about 44,000 licensed beds, including general acute care (197 facilities), behavioral (70), inpatient rehab (114), and long-term acute care (20) and freestanding ER/urgent care (43). They invest in both sale-leasebacks as well as direct investing. For the 2nd quarter, EPS was reported at $0.29, the same as the previous year, and FFO/share was $0.48, compared to $0.46 for the same period last year. The stock is down 57.21% over the past year, and down 64% over the past 5 years.
So that’s it for today, folks. The industry has some good performers, and some of these stocks have real potential as the aftermath of the pandemic works its way out. As always, I’m not an investment advisor, and this is not a solicitation or recommendation to invest in anything. Further, I and the entities I’m involved with may have positions or interests in one or more of the securities discussed here. However, if you have any questions about this, please don’t hesitate to reach out.
John A. Kilpatrick, Ph.D., MAI
Share this:

REIT Report — Health Care Sector
Last week, I talked about the Office REIT sector and some of the headwind problems it’s facing. I’ve been tracking the Health Care REIT sector for a while as well, and next week’s report will be specific to those 15 publicly traded REITs.
In the meantime, though, I wanted to review a timely and informative article written this month by Edward F. Pierzak for NAREIT titled “Aging of U.S. Population to Provide Strong Demand for Health Care REITs.” Of course, this is a prediction that’s been hovering around the industry for more than a few years.
The Census Bureau projects that 20% of Americans will be age 65 or older by the end of this decade, an increase from about 16% at the beginning of the decade. By 2034, the number of us over 65 will be greater than the number under 18 for the first time in U.S. history. Given all this, it’s not surprising that Health Care REITs account for 8% of the FTSE NAREIT All Equity REIT index.
Some overarching facts driving the fundamentals of this sector include:
- According to Green Street Advisors, about 80% of demand for senior housing comes from the growing 75-and-older cohort.
- Seniors in their early-to-mid 80’s are the primary cohort for assisted living and memory-care subsectors.
- Seniors age 65 and older tend to visit the doctor 2½ times as often as middle-agers.
One problem in the sector is the high level of debt. Most REITs are fairly well insulated from the current debt market problems. Ironically, in past years, Health Care has benefitted from its somewhat unique level of access to unsecured debt. However, what was an advantage in yesteryear is coming back to haunt the sector today.
Nonetheless, 2nd quarter data from NAREIT suggests Health Care REITs are delivering solid performance and are keeping pace with inflation. According to Mr. Pierzak’s report, funds from operations (FFO) increased 20.3% year-over-year and net operating income (NOI) was up 8.1%, on average.
The average one-year total return in the sector was negative 5.14%, and five-year returns averaged an anemic 0.92%. This is in the face of an average dividend yield of 5.23%. The total market cap of the 15 REITs in this sector totals $102.33 Billion.
I’m planning on another run-down of returns in this sector next week. In prepping for that, I can’t help but notice that many Health Care REITs report in their 2nd quarter SEC filings that the overhang from the pandemic continues to haunt them. I’ll discuss a bit of that next week, and perhaps a more fulsome look at the pandemic’s impact on this sector in coming weeks.
Again, and as always, I’m not an investment advisor, and this is not a solicitation or recommendation to invest in anything. Further, I and the entities I’m involved with may have positions or interests in one or more of the securities discussed here. However, if you have any questions about this, please don’t hesitate to reach out.
John A. Kilpatrick, Ph.D., MAI
Share this:

REIT Report — Office REITs
As I mentioned before, I track the REIT universe pretty closely, and we have a REIT-based fund called ACCRE. Starting a couple of weeks ago, I began tracking publicly traded REITs that are members of NAREIT on a sector-by-sector basks. My goal is to cover the entire REIT universe each quarter then loop back through. Today, I’m taking a look at the 19 Office REITs in NAREIT, 17 of which have a one-year trading history. As you can seek, office REITs have generally had a tough year, with one rare exceptions.

Empire State Realty Trust (ESRT) is principally an office REIT, although they also own retail and multi-family assets focused mainly in Manhattan and surrounding Greater New York. Their name comes from the fact that their flagship property is the Empire State Building. As of June 30, they own about 8.6 million rentable square feet of office space, 718,000 rentable square feet of retail, and 721 residential units across 3 residential properties. In the 2nd quarter, ESRT earned $0.14 per share (EPS), with core funds from operations (FFO) of $0.26 per share. They report a 90.3% occupancy rate across their entire commercial portfolio, and 91.6% on their Manhattan properties. Same-store cash net operating income (NOI) increased 1.1% year-over-year. Over the past year, ESRT’s stock has returned 17.76%.
Corporate Office Properties Trust (OFC) owns and operates 22.9 million square feet spanning 192 buildings in what they call their “core” portfolio. (OFC also owns two other buildings in what they call their “other” segment). Of these offices, 20.9 million square feet in 186 buildings are leased to defense/IT tenants. Their overall occupancy rate is 95%, with a reported 96.8% in the defense/IT sector. In the 2nd quarter, they reported EPS of $0.27 and FFO/share of $0.60. Over the past year, their stock has fallen 6.1%.
S.L. Green Realty (SLG) claims to be New York City’s largest real estate owner. They own 60 buildings containing 33.1 million square feet, of which 28.8 million are in Manhattan. They reported a net loss of $5.63 EPS for the 2nd quarter, compared to a positive $0.70 the same quarter last year. This loss was attributed to a previously-reported write-down of the carrying value of a leasehold interest at 625 Madison Avenue. FFO/share for the 2nd quarter came in at $1.43/share, compared to $1.87 for the same quarter last year. Manhattan occupancy was reported at 89.8% as of June 30. Their stock declined 17.84% over the past year.
Cousins (CUZ) is an Atlanta based office REIT primarily focused on sunbelt properties. They own 20 million square feet in Arizona, Texas, Tennessee, North Carolina, Georgia, and Florida, reportedly 90% occupied. CUZ reported $0.15 EPS in the 2nd quarter compared to $0.23 the same quarter last year. FFO/share was $0.68, compared with $0.70 the same quarter last year, and NOI for the 2nd quarter was 8.1% higher than the same quarter last year. CUZ stock fell by 19.32% over the past year.
Boston Properties (BXP) owns 191 properties totaling 54.1 million square feet primarily in six key markets: Boston (49 properties), Los Angeles (27), New York (26), San Francisco (37), Seattle (2) and Washington, DC (36). Total occupancy as of the end of the 2nd quarter was 88.3%. EPS for the 2nd quarter was $0.66, compared with $0.50 in the same quarter last year, and FFO/share was $1.86 versus $1.73. The stock was down 23.66% over the past year.
Highwoods Properties (HIW) is headquartered in Raleigh, NC, and owns 27.6 million square feet of office space in Texas, Tennessee, Virginia, North Carolina, Georgia, Florida, and Pennsylvania. Reported occupancy is 89%. EPS for the 2nd quarter was $0.40, compared to $0.48 the same quarter last year, and FFO was $0.95 compared to $1.00 a year ago. The stock price is down 25.42% over the past year.
Kilroy Realty (KRC) is primarily an office REIT, but also owns life science, retail, and residential properties. KRC owns a total of 120 properties with 16.2 million square feet of space and with reported occupancy of 90.8%. They also own 1,001 residential units. EPS was reported at $0.47 for the 2nd quarter, an increase of 17.5% from the same quarter last year, and FFO/share was $1.19, up 1.7%. The stock price over the past year declined 27.05%.
Alexandria Real Estate Equities (ARE) owns 74.9 million square feet of offices in Seattle, the San Francisco Bay Area, San Diego, Greater Boston, New York City, Maryland, and the Research Triangle, with a focus on the life sciences niche. They also have 3 non-US properties. EPS for the 2nd quarter was $0.51, down from $1.67 the same quarter last year. FFO was $2.24, compared to $2.10. Year-over-year, the stock price is down 28.24%.
Equity Commonwealth (EQC) is the office REIT founded by the late Sam Zell, who passed away in May. While based out of Chicago, EQC owns 1.5 million square feet in four office buildings in Colorado, Texas (2), and DC., reporting an 82% occupancy rate. For the 2nd quarter of this year, EQC reported EPS of $0.12, compared with $0.01 the same quarter last year. FFO/share was $0.22, compared with $0.04 the same quarter last year. EQC’s stock fell 28.57% over the past year.
Easterly Government Properties (DEA) focuses on GSA-leased properties throughout the U.S. They own or joint-venture 86 such properties encompassing 8.6 million leased square feet, of which 85 are leased primarily to the U.S. government. For the 2nd quarter, EPS was $0.05 compared to $0.08 last year, and FFO/share was $0.29, compared to $0.33. DEA’s stock price is down 30.5% over the past year.
Paramount Group (PGRE) owns or joint ventures 18 office properties in New York City and San Francisco, with occupancy reported at 88.8%. EPS for the 2nd quarter was negative $0.22, compared to $0.00 the same quarter last year. FFO/share was $0.18 compared to $0.24 last year. The stock price is down 30.5% over the past year.
Creative Media and Community Trust Corp (CMCT) focuses on office and multifamily properties in emerging communities, with an emphasis on technology, media, and entertainment. They currently own 25 properties, including 13 offices (1.3 million rentable square feet) one 503-room hotel, and three multi-family properties. CMCT reports an 83% occupancy across all of their office properties, up from 78.1% last year, and 83.9% for the multi-family. Their stock is down 40.49% over the past year.
Franklin Street Properties (FSP) focuses on infill and central business district (CBD) office properties in the sunbelt and mountain west, as well as selected opportunistic investments. They own 20 properties and one consolidated sponsor REIT totaling about 6.3 million square feet in 7 states. Occupancy is reported at 73.3%. For the 2nd quarter, they reported a negative EPS of $0.08 (compared to a negative $0.09 for the same period last year), and FFO/share of $0.07 (compared to $0.10 last year). Their stock has declined 41.12% over the past year.
Brandywine Realty Trust (BDN) owns 24 million square feet of office space primarily in Austin (23 properties), and the Greater Philadelphia/Washington, DC corridor (138 properties) with a reported occupancy of 89.6%. For the 2nd quarter, they reported a negative EPS of $0.08 compared to a positive $0.03 last year. FFO/share was $0.29, down 18% from the previous year. The stock price is down 42.26% year-over-year.
Piedmont Office Realty Trust (PDM) is an Atlanta-based REIT with 51 properties encompassing 16.7 million square feet in Atlanta, Boston, Dallas, Minneapolis, New York, Orlando, and the Northern Virginia/DC area. They report that their properties are 86.2% leased, which is down slightly from the 2nd quarter last year. EPS for the 2nd quarter was negative $0.02, compared to $0.06 for the same period last year. FFO/share was $0.45 compared to $0.50. The stock is down 46.49% over the last 12 months.
Hudson Pacific (HPP) is headquartered in Los Angeles, and principally owns offices (50) and movie studios (4) on the west coast including British Columbia and in the U.K. plus 8 development properties. They also own approximately 90 sound stages and 1,600 production vehicles in Hollywood. Occupancy rates for their offices is reported at 85.2%, and for the studio properties at 86.5%. Hudson is actively repositioning and developing properties. For the 2nd quarter of this year, EPS was a negative $0.26, compared to a negative $0.05 for the same period last year. FFO/share was about $0.29 in the 2nd quarter, a decline of about 30% from the previous year. HPP stock is down 50.38% for the last 12 months.
Office Properties Income Trust (OPI) focuses on single-tenant offices, with a large number of government tenants. They own 155 properties spanning 20.8 million square feet in 30 states and D.C. and report a 90.6% occupancy. EPS for the 2nd quarter was a negative $0.25, compared to negative $0.33 the same period last year, and FFO/Share was $1.11, compared to $1.22. Their stock is down 67.87% over the past year.
We’re also tracking Orion Office REIT, which has no trading history to report yet. Orion was formed as a result of the spin-off from the Realty Income and VEREIT merger. Its portfolio is comprised of substantially all of the office properties of both companies and is primarily focused on single-tenant net lease offices in attractive suburban markets, particularly in the Sunbelt. As of the end of the 2nd quarter, they owned 81 properties in 29 states with an aggregate of 9.5 million leasable square feet of office and an occupancy rate of 86.5%. EPS for the 2nd quarter was a negative $0.28, compared to negative %0.27 for the same period last year, and FFO/share was $0.48 compared to $0.50.
Finally, American Strategic Investment is technically still a member of NAREIT, but it terminated its election to be taxed as a REIT earlier this year, and effected a reverse stock split along with a secondary offering of Class A shares. They currently own office properties in New York City, and are now expanding into hotel and parking lot operations.
Again, I’m not an investment advisor, and this is not a solicitation or recommendation to invest in anything. Further, I and the entities I’m involved with may have positions or interests in one or more of the securities discussed here. However, if you have any questions about this, please don’t hesitate to reach out.
John A. Kilpatrick, Ph.D., MAI
Share this:

Miscellaneous Habits of Highly Effective People
One thing I truly miss about running a large organization is the opportunity to mentor young people in the early stages of their life journeys. I hesitate to use the word “career” because that suggests a path that not everyone ends up following. For example, one young fellow came to work for us with us fresh out of his Masters degree program. I can’t recall if we were his first job or second, but he was pretty early in his career. After a few years, he decided to take off for New Zealand to hike and mountain climb. Somewhere along the way he met his special someone and came back to us. Then he decided to get his Ph.D. and did some remarkable research at the doctoral level. After a stint back with us, and a stint teaching college, he ended up as an equity partner at a fabulous tech company, where he continues to do interesting stuff.
In my own life, my best mentors were never my best friends. Bosses who tough on me, demanding, goal setting, and hard to please turned out to be the ones from whom I learned the most. As an example, one of the greatest Generals of the between-the-wars period was Fox Connor, who made a habit of finding young Army officers who needed grooming. One young Major joined General Connor’s staff at a point when his career was stagnating and the likelihood of getting into the Command and General Staff School (a necessity for further advancement) seemed distant. General Connor saw something in this young fellow that others hadn’t seen, and spent several years as a hard task master, teaching him how to be a senior officer. Finally, with General Connor’s encouragement, he made it into the prestigious school, and young Dwight Eisenhower graduated number one in his class.
One thing I used to do was give every new analyst I hired a copy of Stephen Covey’s Seven Habits of Highly Effective People. I didn’t expect them to use it as a cookbook, but it had some important ideas that young up-and-comers needed to know. However, in my humble opinion, one of Covey’s best ideas has been misinterpreted over the years, that of the 2-by-2 “important” versus “urgent” matrix. I have to admit that for a long time, I also misused this vital tool. It really wasn’t until later in my career that I “amended” the idea with a bit of my own seasoning, and my version is shown below.
The italicized numbers in red are my addition, and I’ll get to those in a minute. For so very many years, I focused my energies almost exclusively on the “Important and Urgent” tasks, and I fear many others do as well. “Important but not urgent” got put in a holding stack until they became urgent and often then got farmed out. “Urgent but not Important” tasks generally got farmed out to subordinates immediately, and tasks that were “Neither Important nor Urgent” ended up in the circular file cabinet.
After a while I learned that I was missing out on a lot of good stuff. Many “Important but not Urgent” tasks might not have seemed urgent to ME, but may have been urgent to someone else. I was missing out on a lot of good will (or worse, engendering “bad” will) by not giving these some attention. Worse, whenever I farmed stuff out to subordinates without at least a bit of personal attention, I was giving some folks the impression that their “important” problems weren’t “important” to me. The same was true with “Urgent but not Important” tasks, because, as I found, “important” or “not important” was often in the eyes of the beholder. Finally, the “neither urgent nor important” file often contained EITHER some neat stuff OR (worse) some stuff that had the very real potential to bite me in the behind if I wasn’t careful.
Thus, the numbers. They represent the proportion of my time that I try to spend on each of these areas. The proportions aren’t hard and fast, but they’re there to remind me not to neglect anything. Important and Urgent items still get my first attention. Rather than deal with “Important but not Urgent” items, I try to break those tasks down into manageable “to do” lists and process them over a period of time, keeping a good written record of what I’ve done and what remains to be done. (Yes, I’m an inveterate list maker.) “Urgent but not Important” stuff gets looked at but in proportion. Unfortunately, yes, some people get disappointed because at the end of the day, not every “Urgent” item gets addressed. Finally, I spend at least a little time everyday poking thru the “Not Urgent/Not Important” stack to make sure nothing bites me in the behind.
By the way, I still get bit, but not as often anymore.
Anyway, just some musings for a Wednesday afternoon. By the way, writing this blog is in the “Important but not Urgent” category.
John A. Kilpatrick, Ph.D., MAI


