Archive for the ‘Uncategorized’ Category
Brief thought on a Wed afternoon
For the quarter ending June 30, McDonalds (yes, the hamburger people) reported gross revenues of $3.76 Billion. Let that sink in.
Of that, only $1.59 Billion was from company owned restaurants. The rest, $2.09 Billion was fees from franchisees. (There was also some minor misc revenue, but not much.) So, of the $2.09 Billion from franchisees, $1.31 Billion was from “rents”. That’s slightly over 1/3 of their entire top line, and it pretty much all flows to the net income line. You see, McDonalds owns boatloads of real estate. They own the dirt under the franchisees locations, and rents that dirt (we call those “net ground leases”) back to the franchisees, as a way of controlling the locations.
I point this out to remind you that yes, McDonalds is in the hamburger biz, but they are much, much, more in the real estate biz. For that matter, so is every business, they often just don’t realize it.
Oh, and I’ll do the quick math for you. That means McDonalds will collect approximately $5.2 Billion in rents this year. Let that sink in, too.
Share this:

Real Estate Adaptive Re-Use
On Wednesday, I’m appearing in a video for the Appraisal Institute on adaptive re-use of real estate. It’s a panel of leading experts designed to provide guidance for AI members and others on the impact of the pandemic. My own contributions will mainly be on the adaptive reuse of brownfields and other contaminated sites, and at the other end of the spectrum, high-end properties, such as historic structures, which are worthy of preservation.. However, I anticipate a wide ranging discussion from the panelists.
Consider a building which still has life in it, or perhaps needs to be preserved for architectural or preservation reasons, but the original uses are no longer economically feasible. One of my favorite examples is the old Greyhound Bus Station in downtown Columbia, SC:

Built in the 1930’s, it was closed in 1987, but designated for preservation and named to the National Register in 1989. It was acquired by a local bank and adaptively re-used, with the old ticket windows becoming teller windows. The bank eventually left, and the building was adaptively re-used again, now as a plastic surgeon’s office. Clearly, the building still has life in it, and in fact contributes to the Commercial Historic District which is now also listed on the National Register.
Within the National Association of Realtors, there is a great organization called the Certified Commercial Investment Member Institute, or CCIM for short. The CCIM designation, awarded to Realtors who meet their exacting standards for ethics, training, and experience is analogous to the Appraisal Institute’s MAI or SRA designations. The CCIM Institute has been on the forefront of tracking adaptive re-use for quite some time now, as this is an important component of the real estate landscape. They issued a great report on this topic in 2018, and if interested, you can download it here.
The CCIM Institute is in the early states of developing an adaptive re-use index, focusing first on major CBDs such as Los Angeles, Dallas-Ft. Worth, Chicago, Atlanta, and Charlotte. Early sampling, reported in their study, suggests that as of 2018, adaptive reuse constituted 1% – 2% of all commercial real estate space in the U.S., and that figure was expected to grow to about 4% as a result of store and mall closings, e-commerce, and artificial intelligence. I would add that this growth rate will probably accelerate due to the impact of the pandemic and the resultant recession. While these numbers may not seem huge, the CCIM Institute suggests that adaptive reuse is in the early states of its lifecycle, and that this will become an important investment vehicle in the same way that historic preservation became investment-worthy in the early 1980s.
Note that Realtor is a registered trademark of the National Association of Realtors.
Share this:

ACCRE Mid-Month Report, August, 2020
Diversification is an oft-misunderstood thing. In an individual business, diversification is generally not a good idea. Internal to the business, there is an old saying, “To Dominate, Concentrate”. Indeed, few businesses have succeeeded in more than one line of businesses (Microsoft, General Electric, and to an extent Apple are among the rare exceptions). External to the business, investors like to see an individual firm concentrate in a very narrow field. That’s a function of the way common stocks work. If I invest in a firm, and it succeeds, I reap the rewards, but if it fails, I only risk what I’ve invested. Heads I win a lot, tails I don’t lose that much. This may be the core secret to why capitalism works so well.
But in a portfolio of investments, we want diversification, for two somewhat different reasons. If I pick 10 stocks at random, and half do well and half do poorly, I will be better off, from a probability perspective, than most managed funds. (The writer, Andrew Tobias, demonstrated this on television back in the 1970’s with a monkey throwing darts at the WSJ stock pages.) This explains the popularity of index funds. Second, if I have a well diversified portfolio, then the ups-and-downs of the various stocks will attenuate one another. My overall portfolio value will rise over time, but without the major swings of the individual components.
Now, that brings us to real estate (and my mid-month report). While it’s been well known and understood for many years that real estate is a great diversifier for portfolios, few investors — even the most sophisticated ones — understand how to take advantage of it. In my experience, the majority of investment advisors know very little about real estate, and hence steer their clients away from it (to the detriment of their clients!).
Anyway, ACCRE continues to outperform the benchmarks both on absolute terms (as noted in our end-of-month report) and on a risk-adjusted (Sharpe Ratio) level. Further, our correlation to the S&P is still right where we want it — in the positive direction, but well under 100%.
| S&P 500: | |
| Average Daily Excess Return | 0.0308% |
| Standard Deviation | 1.3537% |
| Sharpe Ratio | 2.2727% |
| ACCRE Fund: | |
| Average Daily Excess Return | 0.0526% |
| Standard Deviation | 1.1405% |
| Sharpe Ratio | 4.6079% |
| Correlation (overall): | 56.3606% |
| Correlation (monthly): | 57.3961% |
The average daily excess return is the daily return minus the t-bill returns for that day. (For consistency, we use the coupon-equivalent daily T-bill price as promulgated by the U.S. Treasury.) The Sharpe Ratio is simply that daily return minus the standard deviation, thus adjusting for volatility risk.
As we’ve noted repeatedly here, these are complicated times for both real estate and investing as a whole. A well-curated real estate portfolio can provide above-average returns, diversification, and risk attenuation. If we can answer any of your real estate questions, please let us know.
Share this:
Eminent Domain and Severance Damages
As I mentioned in my newsletter last week, several of our investment clients – and their attorneys – have called recently about eminent domain “takings” of their investment property. Specifically, the acquiring agencies often fail to understand how a partial acquisition can impact the highest and best use – and thus the value – of the part remaining.
Let’s take a very simple example, which is actually drawn from our files from several years ago. A highway department wants to change the turn radius on a thoroughfare, and will “take” a slice of the front of a car dealership. The before-and-after sketch looks a bit like this:
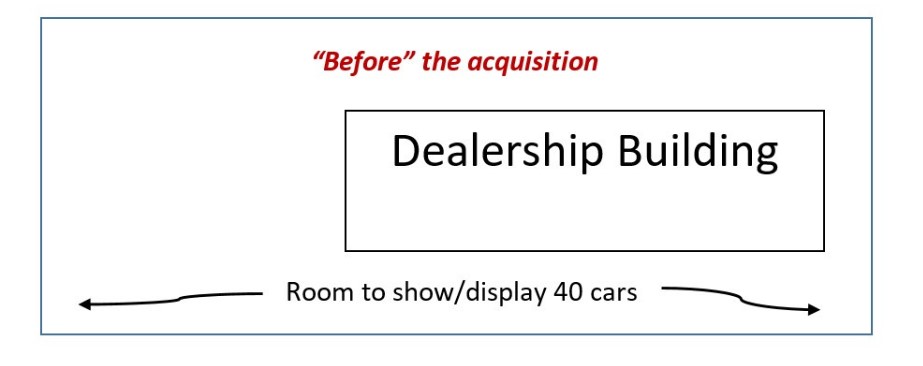
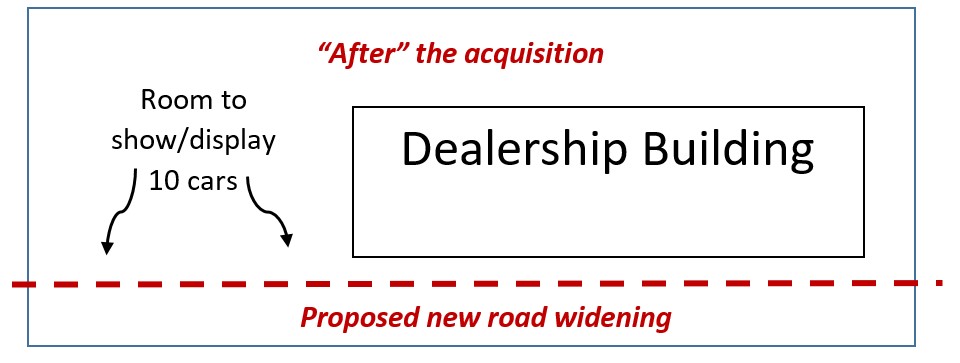
The highway department proposed that since they were only taking about 20% of the land, and none of the building, the highway department proposed a very minimal estimate of just compensation – about 5% of the total value of the site. However, the dealer was able to successfully show that the highest and best use of this site was for a car dealerships, and those were valued heavily on the ability to provide road-frontage display of cars. Hence, the loss of the ability to display 30 vehicles was a very real damage to the remainder. The Court accepted the dealer’s theory on this, and the just compensation was significantly higher than originally proposed.
My good friend, David Matthews, and I wrote a chapter about “Rails to Trails” acquisitions in the Appraisal Institute’s 2019 book, Corridor Valuation. In it we noted, that the severance damages to the adjacent properties can often exceed the value of the rail right of way being taken. In a recent court case in Oregon, a landlord provided overflow parking for a rental house on an adjacent parcel, which was “taken” for a transportation easement. The rental house itself wasn’t touched, per se, but now the tenants would have to park on the street. The landlord was able to show that the loss of the adjacent parcel impacted the marketability of the rental house. In Sweden, they have done exensive studies on the value impact of new rail lines on adjacent residential and commercial properties, and found that the noise has a statistically significant impact on value, even when no actual land is being taken.
The examples go on, and while this may seem to be a situationally specific problem, there are extensive common themes and common methodologies which can be brought to bear to measure this. You’ll probably see more about this from us in the very near future.
Share this:

ACCRE LLC, July, 2020
It was a great month for the market as a whole and real estate in particular. ACCRE earned 7.08% in July, and is now back up above where it stood on Jan 31 (roughly, before the short bear market). Comparatively, the S&P earned 5.51% in July, and the S&P Global Real Estate Index earned 3.08%.
Why is real estate doing well? In part, because the market as a whole is doing well, and there is a lot of liquidity flowing into blue chips and safe vehicles. Further, the soft sectors in real estate were obvious from the beginning — big retail, hospitality, and such. Those tanked early. ACCRE was out of those sectors before the melt-down, so didn’t suffer as badly as the Global Real Estate index. Successful RE fund strategies this year have been fairly obvious — data centers, some industrials, selected office funds, and infrastructure. Of course, not all strategies are alike — some apartments, for example, are heavily weighted in student or senior housing. Some industrial are tied more closely to retail. Some offices are doing well, and others are exposed in the wrong areas. It’s all in the details, as they say.
Anyway, we hope your investment strategies are doing well. We’ll be back mid-month with our diversification report. Until then, best wishes, and stay safe!
Share this:

Seven Biggest Real Estate Mistakes — Part 6
To bring new readers up to date, I began a series back in the winter on real estate investment mistakes. This was a follow-up to my new book, Real Estate Valuation and Strategy. Before the Covid-19 pandemic, we’d planned on a speaking tour to promote the book, and so these blog posts would serve as the notes. Well, that hasn’t happened yet!
Anyway, let’s get started with today’s entry. (At the end, I’ll give newbies a quick link to the first 5.)
Mistake #6 — Getting Emotionally Involved
I was on Wall Street nearly 40 years ago at the beginning of the “behavioral finance” era. Before then, we considered two investment laws to be sacrosanct: efficient markets and rational expectations. The first law told us that investors, by and large, had good information and made use of that information. The second told us that you couldn’t out-guess the market, because, on the whole, investment prices properly reflected the present value of all future benefits. Over the years, behavioral finance has taught us that both of these so-called “laws” are just wishful thinking. People may have all the information they need, but they make scant use of it. Further, investment prices may wildly vary from true intrinsic values. This is particularly true of real estate, for which prices and values may be two completely different things. Understanding that fundamental truth is key to successful investing.
But why? Why don’t investors properly price assets? Why do they buy assets at the wrong price, or more to the point, why don’t they sell assets (or buy more!) when the prices and values differ? One major reason is emotional involvement. Simply put, people fall in love with something, in this case, an real estate investment. It’s why they overpay for something, and why they fail to dispose of it (or convert to something else) when the values and prices diverge.This doesn’t just happen with individual investors — it also happens with large entities, such as corporations, trusts, pension plans, and the like. Indeed, since the dollars are usually larger with these institutional investors, and the penalties for mistakes aren’t necessarily felt by the people making the mistakes, the corporate screw-ups can be markedly worse. For example:
One shopping center developer had a set of very specific rules for chosing a new site, and fell in love with those rules to the point of ignoring any contra signals. They bankrupted the entire company by choosing a site based on those rules even though there were other signals pointing in exactly the opposite direction.
This problem is probably worse with homeownership, but indeed spreads to commercial property no less frequently. One investor we know accumulated considerable real estate in support of his business interests. He eventually called us in to evaluate his portfolio, and we found that many — perhaps most — of his holdings were no longer useful for his business. The obvious recommendation was to sell and redeploy the cash into more focused and business-related holdings and diversification for his family portfolio. However, the investor had held these properties for so many years, and had come to know the long-term tenants on a near-family basis. In the end, the investor simply held on to a smorgasbord of unrelated properties that required considerably more effort to manage than they were worth.
One long-established and successful family real estate fund dissolved over a minor cash-flow hic-cup. The individual family members did quite well in the dissolution, but were so in love with the family real estate holdings that they ended up in pointless and expensive litigation over the matter.
Of course, emotions often drive investment decisions. We consider family and estate issues, building wealth, and eventual retirement or other goals. All of these are fraught with emotional content. As such, it’s easy to fall in love with an investment, particularly if it has performed well until now. Remember a few adages about investing:
An investment doesn’t care who owns it. Hence, you may fall in love with a particular investment, but it doesn’t love you back!
It’s often easy to brag to friends about particularly attractive or up-scale properties. Nonetheless, less attractive shacks may be better performers, both for income and for capital gains.
Behave like Mr. Spock, not Dr. Spock. The former was a Vulcan who was ruled by logic, not emotion. The latter dealt with cute, cuddly babies. Too often we think of our investments as cute, but we need ruthless Vulcan logic to succeed in real estate.
Before we go, I’d promised to give you links to the first five of these tips. In a couple of weeks, we’ll conclude this series with the seventh and last big mistake. Until then, stay safe, and as always, reach out if you have any questions.
Mistake #1 — Misuse of Leverage
Mistake #3 — Not Realizing You Own Real Estate
Mistake #4 — Trying to Catch a Falling Knife
Mistake #5 — Right Property, Wrong Location
Share this:
ACCRE Mid-Month Report
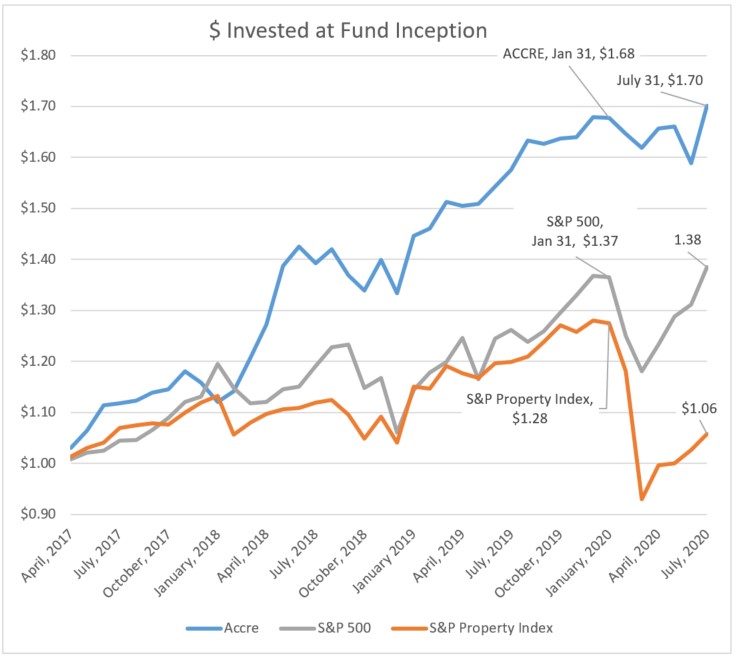
We started ACCRE back in 2017 with two ideas in mind. First, we wanted to “beat” the S&P 500 by 2 times. As of the end of June, a dollar we invested in ACCRE at the inception was worth $1.59. If we’d invested that same dollar in the S&P, it would only be worth $1.31. So, we’re two cents away from our goal, and that’s not too shabby. By the way, real estate in general has taking a pounding this year. That same dollar invested in the S&P Global Real Estate Index grew to $1.28 by January 1 of this year, and has now fallen to $1.03. OUCH!
Our second goal was to provide diversification and more to the point attenuate the risk in our overall portfolio. We measure that in two ways. The first way is to compute the Sharpe Ratio, which looks at the daily “excess returns” (the daily return over and above what we would have earned if we put the money in T-Bills) and divide that by the standard deviation of those returns (a common measure of risk). A higher Sharpe Ratio means that we are getting more bang for the buck when adjusted for risk. You can theoretically get very high returns if you a willing to risk high volatility, and the Sharpe Ratio accounts for that.
The next way of measuring diversification and risk attenuation is to measure the correlation with the S&P 500. In other words, does our fund move in lock-step with the rest of the market, or is it uncorrelated? Uncorrelated in this case is good — it means that we can use ACCRE to smooth out the variability in the rest of our portfolio without sacrificing returns. By the way, we compute correlation both from the inception of the fund and on a month-to-month basis.
| S&P 500: | |||
| Average Excess Daily Return | 0.0250% | ||
| Standard Deviation | 1.3648% | ||
| Sharpe Ratio | 1.8306% | ||
| ACCRE Fund: | |||
| Average Excess Daily Return | 0.0455% | ||
| Standard Deviation | 1.1412% | ||
| Sharpe Ratio | 3.9850% | ||
| Overall Correlation | 56.515% | ||
| Monthy Correlation, June, 2020 | 60.394% |
As you can see, we’ve consistently beaten the S&P 500 both on raw average daily excess returns but also on the Sharpe Ratio. Note that the standard deviation — the measure of volatility — is significantly lower for ACCRE than for the S&P. The correlations are positive, but considerably less than 100%, which suggests that while both have benefitted from this long Bull Market run, the two have followed somewhat different paths to profits.
These are complicated times for real estate. That said, a well selected and properly curated real estate portfolio, either in hard assets or securities, can provide above average returns, diversification, and risk attenuation. If we can answer any of your questions, or you just want to chat, please let me know.
Share this:
Commercial Real Estate 2020
Can anyone disagree that it’s been a truly lousy year for real estate in general? That said, those with carefully curated portfolios are doing better than expected, given the recession and the pandemic. It may be helpful to get into the nitty-gritty.

The chart data comes to us from the good folks at the National Association of Real Estate Investment Trusts (NAREIT) and specifically the FTSE Indices, which span about $1.1 Trillion in market capitalization of REITs by sector. Most REITs had a great year in 2019, with some notable exceptions. Regional Malls were already in some trouble, and self-storage was a bit of an underperformer. However, single family home REITS (which primarily invest in rental houses), timber, infrastructure, and industrial all had a banner year last year.
This year, and somewhat expectedly, data centers and infrastructure are still doing well, showing positive returns. The work-at-home and school-from-home has put double duty on the nation’s internet infrastructure. Add to this the increased burdens of Netflix, Amazon Prime, and the like, and you can immediately see that if trends continue, the revenues and profits from those sectors have significant growth prospects.
Retail is a mixed bag. In my own observation, many retail establishments are doing “OK” — those which serve necessities (groceries, pharmacies). Historically, “big box” hardware (Lowes, Menards, Home Depot) did well in recessions, because flat-line home sales led to people fixing up the homes they already owned. However, this has changed a good bit this year. The breadth and depth of this recession has put pause to all but the most urgent home repairs. Other sorts of discretionary shopping (clothing, furniture) are at a near standstill.
I would note that in most recessions, household formations continue, and this feeds into the dynamic of residential (apartments, rental housing). However, in 2010, household formations nearly ceased, causing a real hic-cup in the housing market. This year could be similar.
There is obviously more in this than meets the eye. If you want to discuss this any further, please reach out. I’d enjoy hearing from you.
Share this:

Seven Biggest Real Estate Mistakes — Part 5
Just to bring new readers up to date, back in the winter, I began a series on real estate investment mistakes I’ve seen over the years. Partially, this was a follow-up to my new book, Real Estate Valuation and Strategy. Before Covid-19 changed everything, we’d planned on a speaking tour to promote the book, and so these blog posts would serve as the notes. Well, we see how THAT worked out!
Anyway, let’s get started. (By the way, at the end, I’ll give newbies a quick link to the first 4.)
Mistake #5 — Right property, wrong location
This is actually a two-edged sword. In some circumstances, finding such a unicorn can provide a great investment opportunity. More often than not, though I observe this as a very real investment mistake.
What makes a property “Class A”? Any sort of property can be in the top tier — offices, hotels, etc. One of the factors that dictates a Class A office, for example, is frontage on a major street in a market with other Class A offices. Think about how many top-tier firms are located in Manhattan on Fifth Avenue, Avenue of the Americas, or Madison Avenue. Now, imagine if that address was moved to a side street. This is an overly simplistic example of how location drives the investment decision.
As another example, think about market demand. How much demand exists in this market for Class A office space? Is the market in transition? Is there growing or shrinking demand for top-tier space? Where are we in the overall market cycle? Overbuilding for a site, for a city, or for a market can be a terrific waste of investment. What is worse, a Class A building, with all the fancy bells and whistles, that only commands Class B rents because of location mistakes, will quickly suffer from lack of maintenance, upkeep, and modernization. The NEXT investor, thinking about buying this property, would probably prefer the Class B building next door in good repair rather than the Class A building that is falling apart due to poor management or lack of funds for upkeep.
Now, I noted that there may be very real opportunities for investors. One of my favorites is locating a Class “C” property in a Class B or A location. Often, such properties are fully depreciated and can be purchased at a discount (thus, resetting the depreciation meter!) but throw off above-average rents due to proximity to high-end investors. Let’s say you are in a business that requires a lot of face-time with high-end, Class A tenants, but your own firm does not need such fancy office space. You may be willing to pay a premium to be in a Class C office, in the central business district, that provides you access to Class A customers. Class C properties may be owned by investors who have simply run out of steam. These properties need some tender loving care, perhaps a bit of fix-up, and can often — not always, but often — become Class B properties with a bit of effort.
Of course, there are limits to this analogy. Class “C” hotels in Class “A” locations are usually just candidates for tear-down (although there are some exceptions!). Conversely, Class “C” restaurant space in Class A locations are often candidates for chic dining establishments. Class “C” rental residential can often be kicked up the ladder to Class B with only minimal expense. Naturally, these opportunities depend on market demand and are situationally specific. However, a fulsome understanding of how properties fit into the market are key to avoiding costly investment mistakes, or on the other hand finding very real investment gems.
Now, I promised you links to the first four tips —
Mistake #1 — Misuse of Leverage
Mistake #3 — Not Realizing You Own Real Estate
Mistake #4 — Trying to Catch a Falling Knife
We’ll be back with #6 and #7 in the next few weeks. Until then, stay safe out there!
Share this:
ACCRE LLC, June, 2020
Monthly statistics hardly tell the story. On a day-to-day basis, this has been an extraordinarily volatile period for all sectors of the market. Our goal with ACCRE continues to be to outperform the S&P 500 while reducing volatility and providing diversification for a broad portfolio. Over the life of ACCRE, we’ve achieved this quite handily. However, the S&P has been doing rather better the past couple of months, while real estate has understandably lagged.

Probably the best measure of this is to compare ACCRE to the S&P Global Property Index (total return) which simply fell out of bed after the onset of the recession. As you can see, it tends to track the S&P 500 fairly well, and hence provides less diversification than ACCRE. Thus, in the last three months, both of these benchmarks have regained some of their lost ground. Conversely, ACCRE has stagnated somewhat since the March sell-off, and had a particularly rough June. However, we continue to dominate both of the benchmarks, both on a life-of-fund basis as well as over the past six months. Thus, I think we’re where we want to be right now.
I hope to have some volatility metrics, Sharpe’s Ratio, and other portfolio data around the middle of July. Stay safe!


