REIT Report — What do the fundamentals say?
Last week, I purposely looked at one of the smallest REIT sectors, Gaming/Leisure, with only two publicly traded REITS (VICI and GLPI) so that this week we could explore some simple tools for fundamental analysis.
VICI, as you recall, is a highly diversified gaming/leisure company with properties in various subsectors all across the US. The stock has trended downward this year and was trading today at $29.17. GLPI is a more focused gaming company that closed today at $46.38. Nonetheless, analysts generally have a favorable view of these two REITs, which begs the question: why?
To address this, I’m going to look at three different fundamental analysis methods useful for studying REITs: the AFFO multiple, the Dividend Discount Model, and the Net Asset Value. AFFO stands for “adjusted funds from operations” and basically measures the cash flow from the business operations, exclusive of cash that may come in from borrowing, asset sales, etc. AFFO gives a good measure of cash available for dividends and/or operational growth. For a given REIT, the price typically trends around a multiple of annual AFFO.
Pure dividend plays (preferred stocks, for example, and low-growth dividend stocks like utilities) can be analyzed as a discounted present value of the future dividends. If those dividends are expected to grow in perpetuity, then this growth can be factored into the equation.
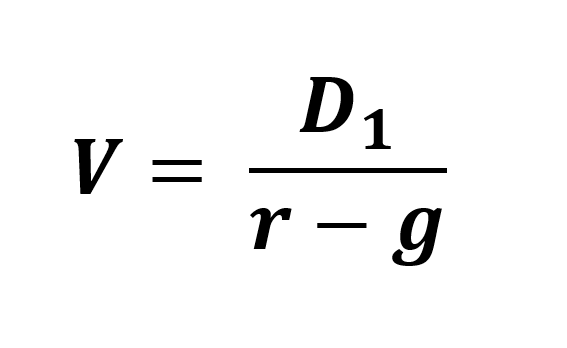
In the above, P is the intrinsic price, D1 is next year’s dividend, r is the expected return on equity capital, and g is the expected perpetuity growth rate.
Finally, every REIT (and any derivative instrument, such as a mutual fund) has a determinable net asset value. For REITs this is simply the expected net operating income capitalized by the expected cap rate, minus any debt. I’ve run these models for the most recent years data, and arrived at the following:
| Price (11/14/23) | AFFO Model | Dividend Model | NAV Model | Overall Value | |
| VICI | $29.17 | $28.75 | $27.44 | $31.17 | $29.12 |
| GLPI | $46.38 | $45.71 | $44.53 | $73.73 | $54.52 |
As you can see, these two REITs are currently trading very close to their estimated intrinsic value, which suggests the markets are working fairly efficiently. What does this say about investment opportunities? I would note that most value investors look for some cushion below the intrinsic value for a buying opportunity — perhaps even a 25% to 40% discount off intrinsic value. Of course, your investment objectives may differ. I would also note that all three of these models depend on a host of assumptions about market discount rates, growth rates, and cap rates, so different intrinsic value models may produce significantly different results.
Thanks to Eli Breece of Dividenology who developed this really great REIT analysis tool. I’ll return to this again in the not too distant future.
As always, I’m not an investment advisor, and this is not a solicitation or recommendation to invest in anything. Further, I and the entities I’m involved with may have positions or interests in one or more of the securities discussed here. However, if you have any questions about this, please don’t hesitate to reach out.
John A. Kilpatrick, Ph.D., MAI


Leave a comment