Archive for November 2023
REIT Report — Lodging Sector
Overall, the lodging sector was probably hit the worst by the pandemic meltdown. While some of the REITs in this sector have managed to recover, others continue to be plagued, particularly by high interest rates and shifting market patterns.

Park Hotels & Resorts (PK) stock has enjoyed a one-year return of 17.52%. Like most hospitality and other REITs with huge retail exposure, they suffered during the pandemic, losing nearly 72% of their stock value in about a month between February 21 and March 20, 2020. Also, like many (but not all) of these REITs, they clawed their way back over the ensuing 12 months. However, PK has languished since then, with a 5-year return of negative 52.68%. PK was a 2017 spin-out of Hilton, and as of the end of the 3rd quarter, they own 43 properties, including 12 resorts, 13 city-center hotels, 5 convention center hotels, and 13 strategic airport and “other” properties. Notably, they also own the Hilton San Francisco Union Square and the Parc 55 Hotel, also in San Fransisco, both of which are presently in receivership. EPS for the third quarter was $0.13, compared to $0.15 in the same quarter in 2022. Third quarter adjusted FFO was $0.5 per share, compared to $0.42 per share for the same quarter in 2022. Debt makes up 60% of their capital stack.
Ryman Hospitality (RHP) is up 6.91% over the past 12 months, and up 27.33% over the five year term, including the beating it took during the pandemic. Ryman owns hotel, resort, entertainment, and media properties, and is headquartered in Nashville, TN, where their signature properties include the Grand Ole Opry and Ryman Auditorium. Their entertainment segment is operated as a taxable REIT subsidiary. For the quarter ending September 30, they reported EPS of $0.64, compared to $0.79 for the same quarter last year. FFO, while not reported on a per-share basis, increased by about 1%$ from the 3rd quarter, 2022, to the 3rd quarter of this year.
Hersha Hospitality Trust (HT) had a one-year return of 3.87%, but this is somewhat misleading. The stock bounded about 60% in one day back in August when it was announced they were going private and would be acquired by KSL Capital Partners. The stock is still traded, however, but has moved very little since that announcement. The deal is supposed to close before the end of this year. Hersha owns 25 hotels with 3,811 rooms in New York, DC, Boston, Philadelphia, Miam, Key West, and California.
Apple Hospitality (APLE) owns 223 hotels totaling about 29,400 rooms in 87 markets across 37 states. The hotels are all branded by either Marriott (99), Hilton (119), or Hyatt (5), almost all in the limited service category, which is sensitive to business travel. EPS for the third quarter was $0.26, the same as the corresponding quarter last year, and FFO was up about 1% over the same period. APLE is up 0.46% over the past year, and up 5.67% over the 5-year period.
DiamondRock Hospitality (DRH) owns 36 premium hotels with 9,700 rooms, aimed at “lifestyle” brands and leisure-focused destination markets (Sedona, Lake Tahoe, Key West, Charleston, etc.). EPS was $0.12 for the 3rd quarter, the same as last year, although FFO was down about 10%. DRH stock is down 0.36% over the past 12 months. DRH went public in August, 2020, after the pandemic meltdown, and is up 1.66% since then.
Host Hotels (HST) purports to be the largest US lodging REIT, with 77 properties totaling 42,000 rooms. They also own non-controlling interests in eight joint ventures. Hotels are generally partnered with up-scale brands, such as Ritz Carleton, St. Regis, and Four Seasons. EPS for the 3rd quarter was $0.16, the same as the corresponding quarter last year. FFO per share was $0.41, compared to $0.38. HST shares are down 4.62% over the past twelve months, and down 8.48% over the past five years.
Service Properties Trust (SVC) owns 221 hotels in 46 states plus DC, Puerto Rico, and Canada, mostly in the extended stay niche operated by Sonesta. (Conversely, SVC owns 34% of Sonesta.) They also own 750 service-focused net lease retail properties totaling 13 million square feet, diversified by tenant, industry, and geography. EPS for the 3rd quarter was negative $0.03, down from positive $0.05 the same quarter last year. The principal difference appeared to be a sharp increase in interest expenses. Notably, debt makes up about 83% of their capital stack. SVC’s stock is down 5.13% over the past 12 months, and down 72.38% over the past five years. Unlike many of the other hospitality REITs, SVC never rebounded after the pandemic downfall.
Sunstone Hotels (SHO) owns 14 hotels totaling 6,675 rooms, generally flagged with well-recognized brands. EPS for the 3rd quarter was $0.23, compared to $0.24 the same quarter last year, and FFO was also $0.23, but they currently expect a downturn in FFO in the 4th quarter to somewhere in the $0.14 to $0.17 range. SHO’s stock is down 6.41% over the past 12 months, and down 34.58% over the 5-year period. The stock rebounded after the pandemic, but has languished since then.
Xenia Hotels & Resorts (XHR) owns 32 hotels, mostly in the sunbelt, with 9,511 rooms. EPS for the 3rd quarter was negative $0.08, compared with a negative $0.01 the same quarter last year. The change was apparently due to a decline in room revenues. Debt makes up about 54% of their capital stack, but there was little change in interest expenses from 2022 to 2023. FFO for that same period is down about 19%. The stock is down 16.25% over the past 12 months, and down 36.28% over the preceding 5 years.
Sotherly Hotels (SOHO) focuses on acquiring, renovating, and up-branding up-scale hotels in the southern U.S. They own all or part of 10 hotels with 2,786 rooms and two commercial condominium properties. EPS for the 3rd quarter was negative 0.20, compared with essentially zero the same quarter last year. The change was largely due to a large increase in interest expenses. Notably, debt makes up about 87% of their capital stack. However, FFO per share for the 3rd quarter was zero, compared with positive $0.12 the same quarter last year. SOHO’s stock is down 19.39% for the past 12 months, and they also did not recover after the pandemic melt-down, resulting in a stock decline of 76.13% over the past 5 years. As of this morning, their stock is trading at under $2 per share.
Pebblebrook Hotel Trust (PEB) aims at upscale hotels in gateway cities. They own 47 properties totaling 12,142 rooms. EPS for the 3rd quarter was negative $0.57, compared to $0.10 the same quarter last year. A number of problems appear on their income statement for the 3rd quarter, including a slight decline in room revenues, an increase in business interruption insurance, a recognition of impairment on some properties, and an increase in interest expenses. FFO, while positive, was down about 16% over the same period. The stock is down 19.9% over the past 12 months, and down 64.23% over the past 5 years.
Chatham Lodging Trust (CLDT) owns 39 hotels with 5,915 rooms as well as four restaurants in California, Texas, and Georgia. EPS for the 3rd quarter was $0.11, down from $0.21 the same quarter 2022. FFO for the same period was down about 20%. Chatham stock is down 21.38% for the past 12 months, and down 47.99% over the past 5 years.
Summit Hotel Properties (INN) owns either all or part of 101 properties in 24 states totaling 15,035 rooms, aimed at the “upscale” segment. EPS was negative $0.05 for the 3rd quarter, down from essentially zero the same quarter last year. The principal reason for the loss was an increase of about 25% in interest expenses. FFO for the same period was $0.22, compared with $0.25. Summit’s stock is down 25.15% over the past year, and down 41.02% over the past 5 years.
Braemar Hotels & Resorts (BHR) owns all or part of 16 hotel properties in 7 states, DC, Puerto Rico, and the Virgin Islands with a total of 4,192 rooms. They focus on high REVpar luxury hotels and resorts. However, about 62% of their capital stack is in debt, and as a result interest expenses nearly doubled. As such, EPS per share in the 3rd quarter was negative $0.50, compared with negative $0.24 the same quarter last year. Additionally, FFO was negative in the 3rd quarter. BHR’s stock is down 38.4% over the past 12 months. While the stock rebounded a bit after the pandemic, it continued to languish, and is now down 76.77% over the past 5 years. As of this morning, the stock was trading slightly above $2 per share.
Ashford Hospitality Trust (AHT) focuses on upscale full-service hotels. They own 100 properties with 22,316 rooms, generally branded by Marriott, Hilton, Hyatt, and Intercontinental. Their debt/asset ratio is about 105.7%, and thus they have a negative book value. EPS for the 3rd quarter was negative $1.99, compared to a negative $0.73 the same quarter last year. While room revenues were slightly up, interest expenses were up about 62%. FFO for the 3rd quarter, while positive, was down about 84% over the same quarter last year. As such, the stock is down 63.36% over the past year, and down 99.5% over the 5-year period, trading at just over $2 per share this morning.
As always, I’m not an investment advisor, and this is not a solicitation or recommendation to invest in anything. Further, I and the entities I’m involved with may have positions or interests in one or more of the securities discussed here. However, if you have any questions about this, please don’t hesitate to reach out.
John A. Kilpatrick, Ph.D., MAI
Share this:

REIT Report — What do the fundamentals say?
Last week, I purposely looked at one of the smallest REIT sectors, Gaming/Leisure, with only two publicly traded REITS (VICI and GLPI) so that this week we could explore some simple tools for fundamental analysis.
VICI, as you recall, is a highly diversified gaming/leisure company with properties in various subsectors all across the US. The stock has trended downward this year and was trading today at $29.17. GLPI is a more focused gaming company that closed today at $46.38. Nonetheless, analysts generally have a favorable view of these two REITs, which begs the question: why?
To address this, I’m going to look at three different fundamental analysis methods useful for studying REITs: the AFFO multiple, the Dividend Discount Model, and the Net Asset Value. AFFO stands for “adjusted funds from operations” and basically measures the cash flow from the business operations, exclusive of cash that may come in from borrowing, asset sales, etc. AFFO gives a good measure of cash available for dividends and/or operational growth. For a given REIT, the price typically trends around a multiple of annual AFFO.
Pure dividend plays (preferred stocks, for example, and low-growth dividend stocks like utilities) can be analyzed as a discounted present value of the future dividends. If those dividends are expected to grow in perpetuity, then this growth can be factored into the equation.
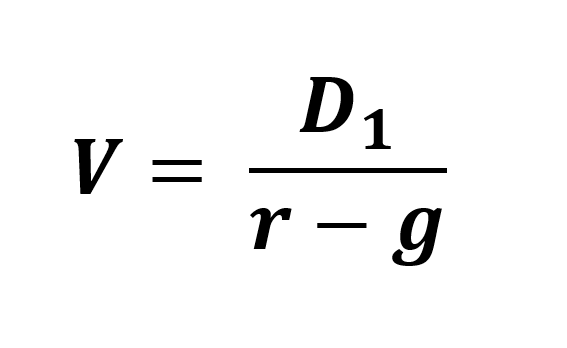
In the above, P is the intrinsic price, D1 is next year’s dividend, r is the expected return on equity capital, and g is the expected perpetuity growth rate.
Finally, every REIT (and any derivative instrument, such as a mutual fund) has a determinable net asset value. For REITs this is simply the expected net operating income capitalized by the expected cap rate, minus any debt. I’ve run these models for the most recent years data, and arrived at the following:
| Price (11/14/23) | AFFO Model | Dividend Model | NAV Model | Overall Value | |
| VICI | $29.17 | $28.75 | $27.44 | $31.17 | $29.12 |
| GLPI | $46.38 | $45.71 | $44.53 | $73.73 | $54.52 |
As you can see, these two REITs are currently trading very close to their estimated intrinsic value, which suggests the markets are working fairly efficiently. What does this say about investment opportunities? I would note that most value investors look for some cushion below the intrinsic value for a buying opportunity — perhaps even a 25% to 40% discount off intrinsic value. Of course, your investment objectives may differ. I would also note that all three of these models depend on a host of assumptions about market discount rates, growth rates, and cap rates, so different intrinsic value models may produce significantly different results.
Thanks to Eli Breece of Dividenology who developed this really great REIT analysis tool. I’ll return to this again in the not too distant future.
As always, I’m not an investment advisor, and this is not a solicitation or recommendation to invest in anything. Further, I and the entities I’m involved with may have positions or interests in one or more of the securities discussed here. However, if you have any questions about this, please don’t hesitate to reach out.
John A. Kilpatrick, Ph.D., MAI
Share this:

REIT Report — Gaming and Leisure Sector
After a week’s break, we’re back this morning with the gaming and leisure sector. There are only two REITs in this group, and they’ve performed remarkably similarly over the past year and 5 years. Both have been steady performers over the recent 5-year span, but like most other REITs, disappointing in the past 12 months.

VICI Properties (VICI) is fairly diversified across the sector. They own or joint ventures 54 gaming facilities and 38 non-gaming “experiential properties”, over 500 restaurants, bars, clubs, & sportsbooks, about 500 retail outlets, and about 60,300 hotel rooms. They also have 33 acres of undeveloped land in and around Las Vegas, including land at or near “The Strip”, and 4 championship golf courses. For example, they acquired the MGM Grand/Mandalay Bay joint venture from Blackstone for about $1.3 Billion in January and have entered the “family entertainment” sector with the acquisition of 38 bowling entertainment centers, known as the “Bowlero Portfolio”, slated to close in the 4th quarter. Their properties are scattered throughout the US and they have several properties in Alberta, Canada. Among their holdings are real estate assets leased on a triple-net basis to such tenants as Caesars, Century Casinos, and Hard Rock. For the 3rd quarter of this year, they reported EPS of $0.55, compared with $0.34 in the 3rd quarter of 2022. FFO per share was $0.54, compared with $0.49 the same quarter last year. Their stock price is down 8.81% for the past 12 months, but up 33.64% over the past 5 years. Of course, this 5-year performance included the trough of the pandemic, when their stock tumbled along with other hospitality and gaming interests. Since that trough, the stock has more than doubled.
Gaming and Leisure Properties (GLPI) is much more focused on gaming. They own 61 gaming and related facilities scattered across 18 states in the US. For example, they own the Tropicana Las Vegas, Bally’s Casino in Black Hawk, CO and related properties, the DraftKings at Casino Queen in East St. Louis, the Hard Rock Casino in Rockford, IL, and the Ameristar Casino Hotel in Council Bluffs, IA. All of their attention is on gaming and related properties. For the quarter ending June 30, they reported $0.59 in EPS, compared with $0.61 for the 2nd quarter of 2022. FFO, which they do not report on a per-share basis, decreased about 4% in the 2nd quarter compared to the same quarter last year. The stock is down 8.82% over the past 12 months, but up 37.35% over the past 5 years. Much like VICI, their stock has more than doubled since the trough of the pandemic.
So that’s it for today, folks. Next week I hope to talk about some of the more general issues facing gaming, leisure, and the related hospitality field.
As always, I’m not an investment advisor, and this is not a solicitation or recommendation to invest in anything. Further, I and the entities I’m involved with may have positions or interests in one or more of the securities discussed here. However, if you have any questions about this, please don’t hesitate to reach out.
John A. Kilpatrick, Ph.D., MAI


