Archive for September 2023
REIT Report — Health Care Shares
This is the second in a 3-part series I’m doing on the Health Care REIT sector. Last week, I reviewed a recent article on this sector which looked at the broader macro-forces affecting the industry. This week is my regular REIT sector 1-year report, and next week I’m going to dive a bit into the recent SEC filings from some of these REITs to discuss specific issues these REITs and the broader industry are facing.
The Health Care sector includes several different property types, including senior living (including assisted living, memory care, and congregate independent living), life sciences, medical offices, and even some specialty niches. The senior living industry is a large portion of this sector and has been adversely affected by the continuing impact of the COVID-19 pandemic as well as the current economic and market conditions. These conditions continue to have a significant negative impact on results of operations, financial position and cash flows. Although there have signs of recovery and increased demand when compared to the low levels during the COVID-19 pandemic, the recovery of senior housing operating portfolios has been slower than previously anticipated. As such, REITs report that they cannot be sure when or if the senior housing business will return to historic pre-pandemic levels. Added to this is the burden of rapidly increasing labor costs and labor shortages.

Diversified Health Care Trust (DHC) owns medical office buildings (36% of their portfolio) as well as a senior living communities (46%), life sciences (13%) wellness centers (4%) and skilled nursing (1%). They own about 27,000 senior living units and about 100 other buildings with about 500 tenants spanning 36 states and DC, with the largest proportion of holdings in the sunbelt, and particularly California, Texas, and Florida. Substantially all NOI comes from private pay properties. The medical offices, life sciences laboratories, and other medical related facilities appear similar to regular commercial office buildings but are engineered with plumbing, electrical, lighting, waste disposal, ventilation, and mechanical systems to support the healthcare field. For the 2nd quarter of this year, they reported negative $0.30 earnings per share (EPS), compared with negative $0.46 the same quarter last year. Funds from Operations (FFO) for the 2nd quarter was $0.01 per share, the same as 2nd quarter 2022. As a result of the post-pandemic challenges, DHC reports substantial doubts as to its ability to continue as a going concern. DHC has entered into an agreement to merge with Office Properties Income Trust (OPI) which is expected to close during the 3rd quarter. As a result, their 1-year stock gain of 95.65% is somewhat misleading. A better picture is told by their 5-year performance, which was down 86%.
Welltower (WELL) focuses on senior housing, post-acute care, and outpatient medical (medical offices). They operate through local partners, such as Balfour, Brandywine, and StoryPoint. Currently they have 1,778 properties in their portfolio, consisting of 852 senior housing properties, 568 medical offices (rented at triple-net) and 358 outpatient medical facilities. The largest number of their properties are in California (11% as of the end of the 2nd quarter), the UK (8%), Texas (7%), Canada (5%), and Pennsylvania (5%). None of their partner entities provide more than 8% of their NOI, the largest two being Integra Healthcare and Sunrise Senior Living. For the 2nd quarter of this year, their EPS stood at $0.20, the same as last year, and FFO/share was $0.93, slightly up from $0.90 last year. As such, their stock is up 24.16% year-over-year. WELL is up about 29% over the past 5 years.
Omega Health Care Investors (OHI) is primarily in the skilled nursing care field, with 893 properties in the forty-two of the US states and the UK with a total of 88,322 beds. The largest concentration of properties is in Florida (11.4%) followed by Texas (10.2%), Indiana (6.6%) and the UK (6.1%). EPS for the 2nd quarter was $0.25, compared with $0.38 for the same quarter last year. Omega contracts with 66 “operators” who lease the facilities from OHI. Indeed, nearly all of OHI’s revenues are from rental and interest income. These operators in turn were impacted by the pandemic via reduced revenues, lower occupancy, increased expenses, and uncertainties regarding reimbursement levels and regulatory support. Their stock is up 10.83% year-over-year, and all of that return has occurred in the most recent 6 months. Over the past 5 years, the stock has cycled a good bit, but today is basically back where it was 5 years ago.
Caretrust REIT (CTRE) invests in skilled nursing facilities (72% of their portfolio, 148 properties), assisted and independent living facilities (15%, 32 properties) and campuses with a mix of services (12%, 25 properties). They have 205 properties in 25 states with 22,311 beds total. Of the total properties, 28% are in California and 23% in Texas. As of the end of the 2nd quarter, 36% of revenues came from one partner (Ensign) and 16% from another (Priority Management Group). EPS for the 2nd quarter was a negative $0.01, compared with $0.21 the same quarter last year. Much of this can be attributed to a recognition of certain impaired real estate assets, attributed to post-pandemic inability of partners to fully meet obligations on certain facilities. Their stock is up 7.36% year-over-year, and aside from the big dip—and-bounce that nearly all REITs experienced during the early days of the pandemic, their stock has been relatively flat over the last 5 years.
Sabra Health Care REIT (SBRA) invests in skilled nursing (55.7% of their portfolio), Senior Housing both managed (15.4%) and leased (10.5%), Behavioral Health (13.6%), Specialty Hospital (4%) and other health care properties (0.8%). They have 392 properties through 67 partners in the U.S., British Columbia, and Alberta. Other than the 61 managed Senior Housing communities, all of their properties are triple-net leased to partners. For the 2nd quarter, EPS was $0.09, up from $0.07 the same quarter last year. FFO was $0.32 per share, down from $0.36 the same quarter last year. While their stock is up 4.26% year-over-year, it has been on a steady downward trend for the past 5 years, down about 40% over that period.
Global Medical REIT (GMRE) is a net-lease medical office REIT which acquires healthcare facilities and leases those to physicians groups and healthcare systems. They own 186 buildings with an aggregate of 4.8 million leasable square feet. Nearly all of their income is from facility rentals. EPS for the 2nd quarter was $0.18, up from $0.03 the same quarter last year, and FFO/share for the second quarter was $0.21, down from $0.24 the same quarter last year. The stock has been nearly flat for the past year, and despite some price swings, the stock is basically in the same place it was 5 years ago.
Ventas (VTR) owns 1,392 properties spanning 24 million square feet including senior living (825 properties), life sciences, research & innovation properties (46), medical & outpatient offices (414), skilled nursing (51) and other health care real estate (56) in the US, Canada, and the UK. Same store NOI for senior housing is reported at 81.3%, while for outpatient medical and research facilities it is 91.7%. EPS for the 2nd quarter was $0.26, up from negative $0.10 the same quarter last year. FFO for that same period, while not reported on a per-share basis, increased about 10.5%, and NOI was up by 7.8%. Ventas stock has been basically flat for the last year, but down about 20% over the past 5 years.
Community Health Care Trust (CHCT) owns 184 properties in 34 states totaling about 4 million square feet, including medical office buildings (85 properties), inpatient rehab facilities (7), specialty centers (37), physician clinics 30), acute in-patent behavioral facilities (5), hospitals and surgical centers (10), behavior specialty facilities (9) and one long-term care hospital. As of the end of the 2nd quarter, 91.7% of properties were leased with a weighted average lease term of 7.1 years. The largest number of their properties is in Ohio (25), followed by Florida (22), Texas (16), Illinois (16), and Pennsylvania (13). Their largest single tenant by gross investment is Lifepoint Health, with 5 properties constituting an aggregate investment of $82.3 million, and their largest tenant by number of properties is GenesisCare with 9 properties and an aggregate investment of $31 million. For the 2nd quarter, EPS was $0.24, compared with $0.21 the same quarter last year. FFO per share for the 2nd quarter was $0.62, compared with $0.57 the same quarter last year. Community Health shares are down 8.71% over the past year, but basically flat over the past 5 years.
National Health Investors (NHI) specializes in sale-leasebacks, joint-ventures, mortgage and mezzanine financing of senior housing and other medical properties. Most of their holdings are in a portfolio of investments in 163 health care properties located in 31 states and triple-net leased to 25 operators. That portfolio includes 97 senior housing communities, 65 skilled nursing facilities, and one hospital. They also have two ventures which directly own 15 independent living facilities in 8 states totaling 1,734 units. EPS for the 2nd quarter was $0.92, compared to $0.47 the same quarter 2022. FFO/share was $1.06, compared with $1.26 the same period last year. NHI shares are down 13.27% from this time last year, and down about 32% over the past 5 years.
LTC Properties (LTC) invests in seniors housing and health care primarily through sale-leasebacks, mortgage financings, joint-ventures, construction financing, and structured finance (preferred, bridge, mezzanine, and tranche lending). Their current portfolio of 148 properties includes assisted living (57.5%, with 97 properties), skilled nursing (41.6%, 50 properties), and 1 other property (0.9%). They have 5,570 assisted living beds and 6,349 skilled nursing beds. Income, however, comes from rentals and interest. EPS for the 2nd quarter was $0.57, the same as last year, and quarterly FFO, while not reported on a per-share basis, was up 4.5% year-over-year. LTC shares are down 18.41% over the past year, and down about 29% over the past 5 years.
Physicians Realty Trust (DOC) owns 227 medical office buildings in 32 states, with approximately 15.6 million leasable square feet, leased to physicians, hospitals, and health delivery systems. As of the 2nd quarter, they reported 95% occupancy, and 91% of the leasable square footage was either on a hospital campus or strategically affiliated with a health care system. EPS for the 2nd quarter was $0.23, the same as the 2nd quarter 2022, and FFO/share was $0.25, compared to $0.27 for the 2nd quarter 2022. DOC is down about 20.36% over the past year, and about 27% over the past 5 years.
Healthpeak Properties (PEAK) invests in lab campuses (3, in San Francisco, Boston, and San Diego totaling 146 properties), outpatient medical usually co-located on hospital campuses (295 properties), continuing care retirement communities (15) and other properties (19). Lab properties and outpatient medical both report a same store occupancy rate of 97.4%, while for the continuing care retirement communities that is 83.4%. EPS for the 2nd quarter was $0.09, compared with $0.13 the same quarter last year, and FFO, while not reported on a per-share basis, increased 12.9% from the 2nd quarter 2022 to the 2nd quarter 2023. PEAK is down 22.45% over the same time last year, and down 28% over the past 5 years.
Healthcare Realty Trust (HR) owns 680 outpatient medical facilities spanning 39.8 million square feet in 35 states. The majority of their properties on the campus of or adjacent to an established health care system, and they report an average of 87.4% occupancy, with 89% in same-store properties. The 2nd quarter EPS was negative $0.22, compared with $0.04 the 2nd quarter of 2022. FFO/share for the 2nd quarter was $0.39, compared with $0.45 the same period last year. Notably, the number of shares outstanding increased from 149.7 million to 378.9 million due to a reverse merger dated July 20, 2022 by and among Healthcare Realty Trust, Healthcare Trust of America, and related holding companies. HR stock is down 28.98% over the past year, with nearly all of that decline happening over the past two months. Over the past 5 years, HR shares are down 47%.
Strawberry Fields REIT (STRW) partners with nine skilled nursing facility operators with a total of 79 properties and 10,189 skilled nursing beds, 63 long-term acute care beds, and 99 assisted living beds in Arkansas, Illinois, Indiana, Kentucky, Michigan, Ohio, Oklahoma, Tennessee and Texas. EPS for the 2nd quarter 2023 was $0.19, compared to zero the same quarter 2022. While FFO is not reported on a per-share basis, it increased by 6.5% from the 2nd quarter 2022 to the 2nd quarter 2023. STRW is down 37% over the past year The stock only began trading in September of last year.
Medical Properties Trust (MPW) is the 2nd largest non-governmental owner of hospitals in the world. Their portfolio of 44 properties spans 10 countries, including the US (61%), the UK (22.4%), Germany (3.9%), Switzerland (3.5%), Australia (1.6%), Spain (1.2%) and others (6.4%). They have about 44,000 licensed beds, including general acute care (197 facilities), behavioral (70), inpatient rehab (114), and long-term acute care (20) and freestanding ER/urgent care (43). They invest in both sale-leasebacks as well as direct investing. For the 2nd quarter, EPS was reported at $0.29, the same as the previous year, and FFO/share was $0.48, compared to $0.46 for the same period last year. The stock is down 57.21% over the past year, and down 64% over the past 5 years.
So that’s it for today, folks. The industry has some good performers, and some of these stocks have real potential as the aftermath of the pandemic works its way out. As always, I’m not an investment advisor, and this is not a solicitation or recommendation to invest in anything. Further, I and the entities I’m involved with may have positions or interests in one or more of the securities discussed here. However, if you have any questions about this, please don’t hesitate to reach out.
John A. Kilpatrick, Ph.D., MAI
Share this:

REIT Report — Health Care Sector
Last week, I talked about the Office REIT sector and some of the headwind problems it’s facing. I’ve been tracking the Health Care REIT sector for a while as well, and next week’s report will be specific to those 15 publicly traded REITs.
In the meantime, though, I wanted to review a timely and informative article written this month by Edward F. Pierzak for NAREIT titled “Aging of U.S. Population to Provide Strong Demand for Health Care REITs.” Of course, this is a prediction that’s been hovering around the industry for more than a few years.
The Census Bureau projects that 20% of Americans will be age 65 or older by the end of this decade, an increase from about 16% at the beginning of the decade. By 2034, the number of us over 65 will be greater than the number under 18 for the first time in U.S. history. Given all this, it’s not surprising that Health Care REITs account for 8% of the FTSE NAREIT All Equity REIT index.
Some overarching facts driving the fundamentals of this sector include:
- According to Green Street Advisors, about 80% of demand for senior housing comes from the growing 75-and-older cohort.
- Seniors in their early-to-mid 80’s are the primary cohort for assisted living and memory-care subsectors.
- Seniors age 65 and older tend to visit the doctor 2½ times as often as middle-agers.
One problem in the sector is the high level of debt. Most REITs are fairly well insulated from the current debt market problems. Ironically, in past years, Health Care has benefitted from its somewhat unique level of access to unsecured debt. However, what was an advantage in yesteryear is coming back to haunt the sector today.
Nonetheless, 2nd quarter data from NAREIT suggests Health Care REITs are delivering solid performance and are keeping pace with inflation. According to Mr. Pierzak’s report, funds from operations (FFO) increased 20.3% year-over-year and net operating income (NOI) was up 8.1%, on average.
The average one-year total return in the sector was negative 5.14%, and five-year returns averaged an anemic 0.92%. This is in the face of an average dividend yield of 5.23%. The total market cap of the 15 REITs in this sector totals $102.33 Billion.
I’m planning on another run-down of returns in this sector next week. In prepping for that, I can’t help but notice that many Health Care REITs report in their 2nd quarter SEC filings that the overhang from the pandemic continues to haunt them. I’ll discuss a bit of that next week, and perhaps a more fulsome look at the pandemic’s impact on this sector in coming weeks.
Again, and as always, I’m not an investment advisor, and this is not a solicitation or recommendation to invest in anything. Further, I and the entities I’m involved with may have positions or interests in one or more of the securities discussed here. However, if you have any questions about this, please don’t hesitate to reach out.
John A. Kilpatrick, Ph.D., MAI
Share this:

REIT Report — Office REITs
As I mentioned before, I track the REIT universe pretty closely, and we have a REIT-based fund called ACCRE. Starting a couple of weeks ago, I began tracking publicly traded REITs that are members of NAREIT on a sector-by-sector basks. My goal is to cover the entire REIT universe each quarter then loop back through. Today, I’m taking a look at the 19 Office REITs in NAREIT, 17 of which have a one-year trading history. As you can seek, office REITs have generally had a tough year, with one rare exceptions.

Empire State Realty Trust (ESRT) is principally an office REIT, although they also own retail and multi-family assets focused mainly in Manhattan and surrounding Greater New York. Their name comes from the fact that their flagship property is the Empire State Building. As of June 30, they own about 8.6 million rentable square feet of office space, 718,000 rentable square feet of retail, and 721 residential units across 3 residential properties. In the 2nd quarter, ESRT earned $0.14 per share (EPS), with core funds from operations (FFO) of $0.26 per share. They report a 90.3% occupancy rate across their entire commercial portfolio, and 91.6% on their Manhattan properties. Same-store cash net operating income (NOI) increased 1.1% year-over-year. Over the past year, ESRT’s stock has returned 17.76%.
Corporate Office Properties Trust (OFC) owns and operates 22.9 million square feet spanning 192 buildings in what they call their “core” portfolio. (OFC also owns two other buildings in what they call their “other” segment). Of these offices, 20.9 million square feet in 186 buildings are leased to defense/IT tenants. Their overall occupancy rate is 95%, with a reported 96.8% in the defense/IT sector. In the 2nd quarter, they reported EPS of $0.27 and FFO/share of $0.60. Over the past year, their stock has fallen 6.1%.
S.L. Green Realty (SLG) claims to be New York City’s largest real estate owner. They own 60 buildings containing 33.1 million square feet, of which 28.8 million are in Manhattan. They reported a net loss of $5.63 EPS for the 2nd quarter, compared to a positive $0.70 the same quarter last year. This loss was attributed to a previously-reported write-down of the carrying value of a leasehold interest at 625 Madison Avenue. FFO/share for the 2nd quarter came in at $1.43/share, compared to $1.87 for the same quarter last year. Manhattan occupancy was reported at 89.8% as of June 30. Their stock declined 17.84% over the past year.
Cousins (CUZ) is an Atlanta based office REIT primarily focused on sunbelt properties. They own 20 million square feet in Arizona, Texas, Tennessee, North Carolina, Georgia, and Florida, reportedly 90% occupied. CUZ reported $0.15 EPS in the 2nd quarter compared to $0.23 the same quarter last year. FFO/share was $0.68, compared with $0.70 the same quarter last year, and NOI for the 2nd quarter was 8.1% higher than the same quarter last year. CUZ stock fell by 19.32% over the past year.
Boston Properties (BXP) owns 191 properties totaling 54.1 million square feet primarily in six key markets: Boston (49 properties), Los Angeles (27), New York (26), San Francisco (37), Seattle (2) and Washington, DC (36). Total occupancy as of the end of the 2nd quarter was 88.3%. EPS for the 2nd quarter was $0.66, compared with $0.50 in the same quarter last year, and FFO/share was $1.86 versus $1.73. The stock was down 23.66% over the past year.
Highwoods Properties (HIW) is headquartered in Raleigh, NC, and owns 27.6 million square feet of office space in Texas, Tennessee, Virginia, North Carolina, Georgia, Florida, and Pennsylvania. Reported occupancy is 89%. EPS for the 2nd quarter was $0.40, compared to $0.48 the same quarter last year, and FFO was $0.95 compared to $1.00 a year ago. The stock price is down 25.42% over the past year.
Kilroy Realty (KRC) is primarily an office REIT, but also owns life science, retail, and residential properties. KRC owns a total of 120 properties with 16.2 million square feet of space and with reported occupancy of 90.8%. They also own 1,001 residential units. EPS was reported at $0.47 for the 2nd quarter, an increase of 17.5% from the same quarter last year, and FFO/share was $1.19, up 1.7%. The stock price over the past year declined 27.05%.
Alexandria Real Estate Equities (ARE) owns 74.9 million square feet of offices in Seattle, the San Francisco Bay Area, San Diego, Greater Boston, New York City, Maryland, and the Research Triangle, with a focus on the life sciences niche. They also have 3 non-US properties. EPS for the 2nd quarter was $0.51, down from $1.67 the same quarter last year. FFO was $2.24, compared to $2.10. Year-over-year, the stock price is down 28.24%.
Equity Commonwealth (EQC) is the office REIT founded by the late Sam Zell, who passed away in May. While based out of Chicago, EQC owns 1.5 million square feet in four office buildings in Colorado, Texas (2), and DC., reporting an 82% occupancy rate. For the 2nd quarter of this year, EQC reported EPS of $0.12, compared with $0.01 the same quarter last year. FFO/share was $0.22, compared with $0.04 the same quarter last year. EQC’s stock fell 28.57% over the past year.
Easterly Government Properties (DEA) focuses on GSA-leased properties throughout the U.S. They own or joint-venture 86 such properties encompassing 8.6 million leased square feet, of which 85 are leased primarily to the U.S. government. For the 2nd quarter, EPS was $0.05 compared to $0.08 last year, and FFO/share was $0.29, compared to $0.33. DEA’s stock price is down 30.5% over the past year.
Paramount Group (PGRE) owns or joint ventures 18 office properties in New York City and San Francisco, with occupancy reported at 88.8%. EPS for the 2nd quarter was negative $0.22, compared to $0.00 the same quarter last year. FFO/share was $0.18 compared to $0.24 last year. The stock price is down 30.5% over the past year.
Creative Media and Community Trust Corp (CMCT) focuses on office and multifamily properties in emerging communities, with an emphasis on technology, media, and entertainment. They currently own 25 properties, including 13 offices (1.3 million rentable square feet) one 503-room hotel, and three multi-family properties. CMCT reports an 83% occupancy across all of their office properties, up from 78.1% last year, and 83.9% for the multi-family. Their stock is down 40.49% over the past year.
Franklin Street Properties (FSP) focuses on infill and central business district (CBD) office properties in the sunbelt and mountain west, as well as selected opportunistic investments. They own 20 properties and one consolidated sponsor REIT totaling about 6.3 million square feet in 7 states. Occupancy is reported at 73.3%. For the 2nd quarter, they reported a negative EPS of $0.08 (compared to a negative $0.09 for the same period last year), and FFO/share of $0.07 (compared to $0.10 last year). Their stock has declined 41.12% over the past year.
Brandywine Realty Trust (BDN) owns 24 million square feet of office space primarily in Austin (23 properties), and the Greater Philadelphia/Washington, DC corridor (138 properties) with a reported occupancy of 89.6%. For the 2nd quarter, they reported a negative EPS of $0.08 compared to a positive $0.03 last year. FFO/share was $0.29, down 18% from the previous year. The stock price is down 42.26% year-over-year.
Piedmont Office Realty Trust (PDM) is an Atlanta-based REIT with 51 properties encompassing 16.7 million square feet in Atlanta, Boston, Dallas, Minneapolis, New York, Orlando, and the Northern Virginia/DC area. They report that their properties are 86.2% leased, which is down slightly from the 2nd quarter last year. EPS for the 2nd quarter was negative $0.02, compared to $0.06 for the same period last year. FFO/share was $0.45 compared to $0.50. The stock is down 46.49% over the last 12 months.
Hudson Pacific (HPP) is headquartered in Los Angeles, and principally owns offices (50) and movie studios (4) on the west coast including British Columbia and in the U.K. plus 8 development properties. They also own approximately 90 sound stages and 1,600 production vehicles in Hollywood. Occupancy rates for their offices is reported at 85.2%, and for the studio properties at 86.5%. Hudson is actively repositioning and developing properties. For the 2nd quarter of this year, EPS was a negative $0.26, compared to a negative $0.05 for the same period last year. FFO/share was about $0.29 in the 2nd quarter, a decline of about 30% from the previous year. HPP stock is down 50.38% for the last 12 months.
Office Properties Income Trust (OPI) focuses on single-tenant offices, with a large number of government tenants. They own 155 properties spanning 20.8 million square feet in 30 states and D.C. and report a 90.6% occupancy. EPS for the 2nd quarter was a negative $0.25, compared to negative $0.33 the same period last year, and FFO/Share was $1.11, compared to $1.22. Their stock is down 67.87% over the past year.
We’re also tracking Orion Office REIT, which has no trading history to report yet. Orion was formed as a result of the spin-off from the Realty Income and VEREIT merger. Its portfolio is comprised of substantially all of the office properties of both companies and is primarily focused on single-tenant net lease offices in attractive suburban markets, particularly in the Sunbelt. As of the end of the 2nd quarter, they owned 81 properties in 29 states with an aggregate of 9.5 million leasable square feet of office and an occupancy rate of 86.5%. EPS for the 2nd quarter was a negative $0.28, compared to negative %0.27 for the same period last year, and FFO/share was $0.48 compared to $0.50.
Finally, American Strategic Investment is technically still a member of NAREIT, but it terminated its election to be taxed as a REIT earlier this year, and effected a reverse stock split along with a secondary offering of Class A shares. They currently own office properties in New York City, and are now expanding into hotel and parking lot operations.
Again, I’m not an investment advisor, and this is not a solicitation or recommendation to invest in anything. Further, I and the entities I’m involved with may have positions or interests in one or more of the securities discussed here. However, if you have any questions about this, please don’t hesitate to reach out.
John A. Kilpatrick, Ph.D., MAI
Share this:

Miscellaneous Habits of Highly Effective People
One thing I truly miss about running a large organization is the opportunity to mentor young people in the early stages of their life journeys. I hesitate to use the word “career” because that suggests a path that not everyone ends up following. For example, one young fellow came to work for us with us fresh out of his Masters degree program. I can’t recall if we were his first job or second, but he was pretty early in his career. After a few years, he decided to take off for New Zealand to hike and mountain climb. Somewhere along the way he met his special someone and came back to us. Then he decided to get his Ph.D. and did some remarkable research at the doctoral level. After a stint back with us, and a stint teaching college, he ended up as an equity partner at a fabulous tech company, where he continues to do interesting stuff.
In my own life, my best mentors were never my best friends. Bosses who tough on me, demanding, goal setting, and hard to please turned out to be the ones from whom I learned the most. As an example, one of the greatest Generals of the between-the-wars period was Fox Connor, who made a habit of finding young Army officers who needed grooming. One young Major joined General Connor’s staff at a point when his career was stagnating and the likelihood of getting into the Command and General Staff School (a necessity for further advancement) seemed distant. General Connor saw something in this young fellow that others hadn’t seen, and spent several years as a hard task master, teaching him how to be a senior officer. Finally, with General Connor’s encouragement, he made it into the prestigious school, and young Dwight Eisenhower graduated number one in his class.
One thing I used to do was give every new analyst I hired a copy of Stephen Covey’s Seven Habits of Highly Effective People. I didn’t expect them to use it as a cookbook, but it had some important ideas that young up-and-comers needed to know. However, in my humble opinion, one of Covey’s best ideas has been misinterpreted over the years, that of the 2-by-2 “important” versus “urgent” matrix. I have to admit that for a long time, I also misused this vital tool. It really wasn’t until later in my career that I “amended” the idea with a bit of my own seasoning, and my version is shown below.
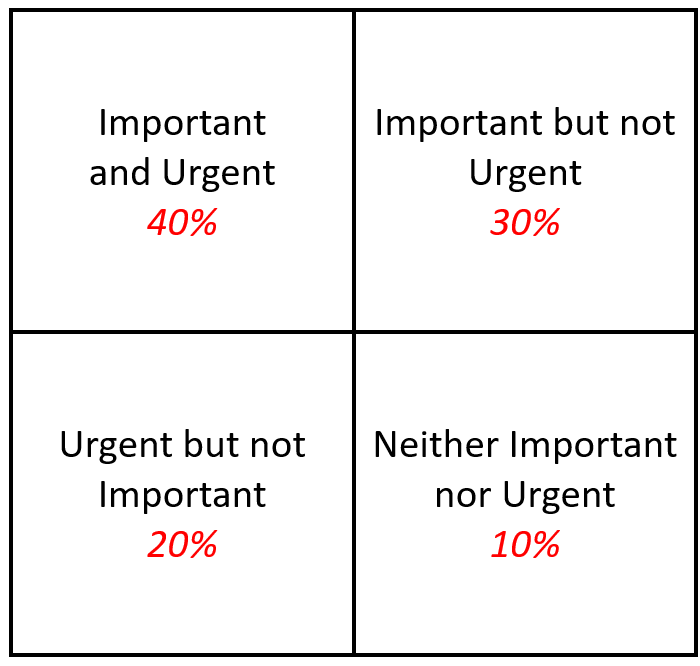
The italicized numbers in red are my addition, and I’ll get to those in a minute. For so very many years, I focused my energies almost exclusively on the “Important and Urgent” tasks, and I fear many others do as well. “Important but not urgent” got put in a holding stack until they became urgent and often then got farmed out. “Urgent but not Important” tasks generally got farmed out to subordinates immediately, and tasks that were “Neither Important nor Urgent” ended up in the circular file cabinet.
After a while I learned that I was missing out on a lot of good stuff. Many “Important but not Urgent” tasks might not have seemed urgent to ME, but may have been urgent to someone else. I was missing out on a lot of good will (or worse, engendering “bad” will) by not giving these some attention. Worse, whenever I farmed stuff out to subordinates without at least a bit of personal attention, I was giving some folks the impression that their “important” problems weren’t “important” to me. The same was true with “Urgent but not Important” tasks, because, as I found, “important” or “not important” was often in the eyes of the beholder. Finally, the “neither urgent nor important” file often contained EITHER some neat stuff OR (worse) some stuff that had the very real potential to bite me in the behind if I wasn’t careful.
Thus, the numbers. They represent the proportion of my time that I try to spend on each of these areas. The proportions aren’t hard and fast, but they’re there to remind me not to neglect anything. Important and Urgent items still get my first attention. Rather than deal with “Important but not Urgent” items, I try to break those tasks down into manageable “to do” lists and process them over a period of time, keeping a good written record of what I’ve done and what remains to be done. (Yes, I’m an inveterate list maker.) “Urgent but not Important” stuff gets looked at but in proportion. Unfortunately, yes, some people get disappointed because at the end of the day, not every “Urgent” item gets addressed. Finally, I spend at least a little time everyday poking thru the “Not Urgent/Not Important” stack to make sure nothing bites me in the behind.
By the way, I still get bit, but not as often anymore.
Anyway, just some musings for a Wednesday afternoon. By the way, writing this blog is in the “Important but not Urgent” category.
John A. Kilpatrick, Ph.D., MAI
Share this:

REIT Report — Adaptive Re-Use
Last week I talked about the industrial sector. I’m hoping to alternate sector analyses with reports about the REIT market in general. Today, the issue of adaptive re-use has caught my attention, and if you are an active REIT investor, it should be of some interest to you as well.
For the uninitiated, adaptive re-use is the repurposing of buildings for some use that has more demand in the current market. For example, I visited some old “rust-belt” cities in the mid-west with underused early 20th Century brick industrial buildings. Many of these buildings had great bones and were often near the more vibrant and transitioning downtown areas. With some brownfield redevelopment assistance, these buildings were repurposed as mixed-use residential, office, and light retail centers.

The Pratt Street Power Plant in Baltimore was converted to retail, restaurants, and office uses.
REITs are working with cities to develop incentives for this redevelopment, such as flexibility in zoning and use requirements. For example, city zoning may be extremely restrictive for office use, but such buildings may be in the right place, and highly adaptable, for light retail, medical laboratories, and even schools.
Prologis (PLD), a REIT I discussed last week, recently issued a report that office-to-logistics conversions are likely in areas with high land cost and limited competition. However, cities need to incentivize by reviewing zoning, entitlement, permitting, and approval delays.
According to Dennis Shea, the executive director of the Terwilliger Center for Housing Policy, key elements include zoning reform, tax abatements, tax incentives, and regulatory reforms. “For example, in Washington, DC, the city relaxed the requirement that certain percentage of construction workers on projects that receive government funding be D.C. residents. They’re also offering a 20-year property tax break to developers who convert commercial buildings to residences.
In San Francisco, in June, city agencies issued a request for information to identify potential sites for adaptive reuse, estimate their feasibility for a conversion, and evaluate regulatory barriers to the projects. In July, Boston announced the Downtown Office to Residential Conversion Pilot Program, reducing property taxes for up to 29 years for commercial properties who converted to residential. California has allocated $400 million for the next two years to encourage adaptive reuse. A further proposal will limit fees, prevent parking requirements, and streamline the approval process if the conversions include an affordable housing component.
In New York City, the Office Adaptive Reuse Task Force recommended a new tax incentive that could create 20,000 new housing units over the next decade. This includes rezoning certain areas in Manhattan to allow residential buildings, streamlining conversion policies to make more buildings eligible, and eliminating parking regulations. Mayor Adam’s and the Department of City Planning laid out a plan to convert vacant offices into housing as part of the “City of Yes” plan. They are also launching an Office Conversion Accelerator to expedite complex office-to-housing conversion projects.
Five projects were recently selected by Chicago for conversion from office to residential use with tax increment financing, grants for retail businesses on the ground floor, low-income housing tax credits, and historic tax credits.
The federal government is also stepping in to encourage adaptive reuse, with the Neighborhood Homes Investment Act to loosen restrictions on density and provide tax credits. the Biden administration announced a working group to leverage federal funding to support commercial to residential adaptive reuse projects. Also, the General Services Administration (GSA) is reviewing underutilized federal buildings for conversion to housing, and HUD is funding research on how to make conversions less costly.
“For a successful adaptive reuse project, you need real estate in a prominent location that’s supported by income growth to sustain the rent, plus you need to be able to convert the property in a way that makes it attractive,” says Shawn Tibbetts, COO of diversified REIT Armada Hoffler Properties (AHH). “It’s not just the right building, it has to be the right market.” His REIT converted the former Dominion Energy headquarters in downtown Richmond to a 174-unit multifamily property using tax credits. They lso converted Chronicle Mill, a former textile mill outside Charlotte, into a mixed-use development, also with tax credits and support from the local government.
“At Chronicle Mill we were able to combine adaptive reuse with a new adjacent building, which also helped make that project financially viable,” Tibbetts says. “Along with the rehabilitation, adding a new building helped lower the overall cost per unit, plus it is an incentive to the city since they gain more taxable property.”
In Rockville, Maryland, for example, BXP (BXP) acquired 31 acres with seven offices that will be demolished and replaced with purpose-built lab space and multifamily housing. “The I-270 corridor is the epicenter of the life sciences market and the office buildings on this site are obsolete,” says Pete Otteni, executive vice president and co-head of the Washington D.C. region for BXP. The location is already amenitized with transportation, shops, and restaurants, so it’s the right kind of environment for us to develop a sense of place.” In Herndon, Virginia, BXP acquired a 10-acre site with 350,000 square feet in two vacant office buildings. They are applying to rezone the site for residential use to allow for 350 apartments and 101 townhouse units.
Despite increased interest, in July the Adaptive Reuse Report from Yardi Matrix reported that in 2022 the conversions of offices dropped 15% from the previous year, to a 10-year low. Nonetheless, Yardi also found that future adaptive reuse projects in the pipeline includes 122,000 converted apartments, compared to 77,000 apartments in the pipeline in 2022’s report. Office conversions are expected to represent 37% of the total, followed by hotels (23%) and factories (14%). Hotel conversions were more popular than office conversions in 2022, and the number of apartments converted from hotels rose by 43% compared to 2021, primarily for affordable housing.
While challenges remain for adaptive reuse, public-private partnerships and concern about revitalizing downtown cores are likely to push developers to find creative solutions for vacant commercial buildings.
Thanks to Michele Lerner writing for NAREIT for most of this information.
Once again, I’m not an investment advisor, and this is not a solicitation or recommendation to invest in anything. Further, I and the entities I’m involved with may have positions or interests in one or more of the securities discussed here. However, if you have any questions about this, please don’t hesitate to reach out.
John A. Kilpatrick, Ph.D., MAI


