REIT Report — Industrials
As regular followers know, I track the REIT universe pretty closely, and we have a REIT-based fund called ACCRE. In the past, I’ve reported on ACCRE’s performance, but I’ve been encouraged to report on the broader REIT market.
I’ve decided to take this one sector at a time, and today we’ll look at the industrials. The sector has generally been strong from a fundamentals perspective, but investors enjoyed some great returns in this sector during and immediately following the pandemic “reset”, and as such returns have overall been flat for the past year. I’m presently tracking ten industrial REITs, with one-year performances all over the map:
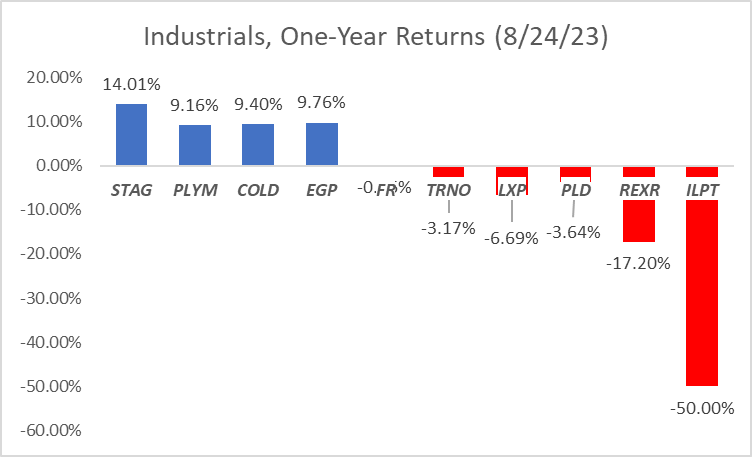
Stag Industrial (STAG) leads the pack with a one-year return of 14.01%, although interestingly enough has only shown sluggish returns over the last 5 years (26.1% net). STAG owns 111.1 million square feet of traditional industrial space spanning 558 buildings in 41 states. In July, they reported $0.29 in net income per share for the 2nd quarter, compared to $0.18 for the same period in 2022. NOI increased 4.3% (again, compared to the same period in 2022) and same store cash NOI was also up by 4.5%. They enjoy an occupancy rate of 97.7% and had a retention rate of 79.6% on leases expiring in the 2nd quarter.
Plymouth REIT (PLYM) shares have increased 9.16% over the past year and 40.36% over the past 5 years. They own 34 million square feet spanning 210 buildings in 13 markets, mainly in the eastern US. They have a portfolio occupancy of 98%. For the 2nd quarter ending June 30, they reported a net loss of $0.08 per share, compared to a net loss of $0.17 per share for the same period last year. Same store NOI increased 3.5% compared to the same period last year.
Americold Realty Trust (COLD) shares increased 9.4% over the past year and 31.81% over the past 5 years. They specialize in cold storage warehouses and have 243 such facilities in North America and Europe. For the 2nd quarter of this year, they reported total revenue decreasing by 11% and a net loss of $0.39 per share. However, core EBITDA increased by 12.1%, NOI increased by 14.5%, and same store revenues increased by 2.8%.
Eastgroup (EGP) enjoyed a 9.76% share price rise over the past year and 82.75% over the past five years. EGP focuses on multi-tenant business distribution buildings, with 55 million square feet in 11 states across the sunbelt. Seventy-nine percent of their portfolio is in California, Texas, and Florida. Their “sweet spot” is in the 15,000 to 70,000 square foot range. Earnings per share for the most recent quarter was $0.97 compared to $1.09 for the same period last year. However, funds from operations increased to $1.91 per share, compared to $1.72 the same period last year. Their operating portfolio is 98.5% leased and 98.2% occupied.
First Industrial Realty (FR) shares declined 0.6% year over year but have risen 58.9% over the last 5 years. They operate 69.4 million square feet of traditional industrial properties spanning 444 buildings widely scattered across the U.S. Net income per share for the 2nd quarter was $0.41, down from $0.88 for the same period last year. Funds from operations per share was slightly up, at $0.61 per share compared to $0.56 per share last year. Property occupancies stand at 97.7%.
Terreno Realty (TRNO) shares have fallen 3.17% over the past year and 56.7% over the past 5 years. they own and operate traditional industrial properties (mainly warehouse/distribution) in six coastal U.S. markets (Seattle, San Francisco, Los Angeles, New York/New Jersey, Washington DC, and Miami) with a focus on infill properties. They own 257 buildings with 15.9 million square feet. Occupancy was 97.8%. Terreno considers its competitive edge being in an established position in markets that have large and growing consumer populations, highly developed transportation infrastructures, and significant physical and regulatory barriers to development. Their largest customers include Amazon (3.6% of total) FedEx (2.1%) and O’Neill Logistics (1.8%. For the 2nd quarter of this year, they reported $0.48 in net income per share, compared to $1.28 for the same period last year.
LXP Industrial (LXP) shares declined 6.69% over the past year and only grew 3% over the past 5 years. LXP focuses on single-tenant industrial properties. They own/operate 109 properties spanning 52.5 million square feet which are currently 99.5% leased. Almost all of their properties are in the eastern half of the US, plus some investments in Phoenix and Portland. they report average annual rent escalations of 2.5% and an average portfolio age of 8.8 years. LXP reported net income per share of negative $0.03 for the 2nd quarter, down from $0.14 per share for the same quarter last year. Total revenues were actually up, but property operating expenses and impairment losses (generally a paper loss) were substantially increased. Net operating income actually increased about 10%. Notably, LXP was one of the stars in the industrial sector from 2019 until early 2022, with a share price nearly doubling. However, since Spring of last year, the price has languished significantly.
Prologis (PLD) is the 1000 pound gorilla in this sector, but its price has declined by 3.64% over the past year. That said, investors over the past 5 years have enjoyed a price increase of 82.58%. Prologis owns and operates 2,926 properties throughout the Americas, Europe, and Asia totaling 619.5 million square feet. The aggregate book value of their real estate holdings as of the end of June was $76.5 Billion. They reported $1.31 per share in earnings for the 2nd quarter, up from $0.82 for the same quarter last year. Total operating income increased by 165%.
Rexford Industrial (REXR) stock declined fairly steadily over the past year, losing 17.2%. That said, like other industrials, it performed very well over the past five years, up 61.15% overall. Rexford is focused exclusively in Southern California with about 44.5 million square feet of traditional industrial warehouses averaging about 98.1% occupancy. For the 1st quarter of this year, Rexford reported earnings per share of $0.30, compared with $0.27 during the 1st quarter of 2022. Total rental income increased by about 32%. However, much of this increase was funded by increased debt — about $300 million in the first quarter alone. A significant portion of the interest expense reported int eh 1st quarter came from losses in interest rate hedges. However, they believe that forward hedges will serve them well in the coming 12 months.
Industrial Logistics (ILPT) has declined 50% over the past year, and 83.8% over the past 5 years. ILPT owns 413 traditional warehouse properties in 39 states totaling 60 million square feet with 99.1% occupancy. However, about 38% of ILPTs revenues come from 226 properties, including long term ground leases, buildings, and easements on the island of Oahu. ILPT reported negative net income of $0.40 per share for the 2nd quarter, which was an improvement from negative $2.20 the same quarter last year. A substantial portion of the loss last year was from recognition of non-cash impairment of real estate. Notably, interest expenses run about 70% of total rental income.
In coming weeks, I hope to cycle thru various sectors, alternating with some general considerations about REIT investing. Naturally, I’m not an investment advisor, and this is not a solicitation or recommendation to invest in anything. Further, I and the entities I’m involved with may have positions or interests in one or more of the securities discussed here. However, if you have any questions about this, please don’t hesitate to reach out.
John A. Kilpatrick, Ph.D., MAI


Leave a comment