Archive for May 2020
ACCRE Mid-Month Report
I hope all is well with everyone! ACCRE continues to chug along, doing somewhat better than the market as a whole. That said, this is the point in the month when I USUALLY provided the market diversification statistics, the Sharpe Ratio, and such and so-forth. I say USUALLY because, frankly, with all the Coronavirus mess, I’ve fallen w-a-a-a-y behind in my reporting duties. Mea culpa and all that, so let’s get started.
For those of you unfamiliar with the terminology, the Sharpe Ratio is a measure of “excess returns” adjusted for risk. What do we mean by “excess returns”? It is the average daily return of the security over and above what would have been earned had that money simply been put into T-bills. (For our benchmark, we use the 13-week, coupon-equivalent rate as published daily by the U.S. Treasury.) The average excess return is then divided by the standard deviation, which is a measure of the volatility risk. Hence, the higher the standard deviation (volatility), the lower the Sharpe Ratio. An investment with a high return and low volatility will have a correspondingly higher Sharpe Ratio. We measure the Sharpe Ratio over the life of the fund (since April 1, 2017):
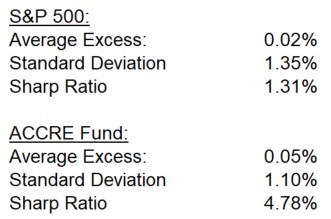
ACCRE has enjoyed both a substantially higher average excess return over its life as well as somewhat lower volatility. Thus, it comes as no surprise that the Sharpe Ratio is nearly four times that of the S&P 500.
One other thing we monitor is the correlation between ACCRE and the S&P 500, which has been historically low — about 41% as of the end of 2019. Indeed, the correlation for the month of December was only 4.8%. Of course, monthly correlations of daily returns suffers from small sample bias, which is one reason why we focus on “lifetime of the fund” statistics. With that, I would note that the correlation over the past few months has been quite high, driving the overall correlation up to about 56%. Still, though, this suggests that ACCRE does a superior job of providing diversification for the portfolio.
We’ll be back after the first of June with our monthly returns report. Best wishes to you all!
Share this:

ACCRE LLC, April 2020
Wow, it is almost the middle of the month and I am JUST getting around to our April report. Mea Culpa, everyone. We’ve been busy. Not a great excuse, but it’s the one I have!
April was a nice rebound month for everyone. Since ACCRE didn’t fall very far, it comes as no surprise that the rebound was comparatively slight. Nonetheless, ACCRE continues to dominate the comparative indices by a tremendous margin.

(For the new readers, these indices are based on a dollar invested as of the inception of our ACCRE fund, April 1, 2017.)
More to the point, since January 31, ACCRE is only down 1.2% ($1.66 versus $1.68). Comparatively, since January 31, the S&P 500 is down 10.2% while the S&P Global property Index is down almost 22%.
I’ll be back in a few days with comparative portfolio stats and such. And, as always, our newsletter subscribers get updates on portfolio makeup and any trades we make.
Best wishes, and stay safe!


